Virtual Service Logs
Overview
Virtual services and pools are able to log client-to-application interactions for TCP connections and HTTP requests/responses. These logs can be indexed, viewed, and filtered locally within the Controller. Logs can be useful for troubleshooting and surfacing insights about the end-user experience and success of the application.
Note: Starting with Avi Vantage version 22.1.3, the tech preview of log view is visible. However, you can toggle between old and new log view.
Enabling Logs
See the Analytics tab of the Create Virtual Service pop-up for configuring, enabling, filtering, and/or disabling client logs.
Significant Logs
NSX Advanced Load Balancer automatically logs common network and application errors under the umbrella of significant logs. These significant logs may also include entries for lesser issues, such as transactions that completed successfully but took an abnormally long time.
Errors may include any of the following:
- HTTP errors, such as server or Vantage-originated 4xx and 5xx errors.
- Network errors, such as aborted connections, abnormal latency, or out of order packets.
- See Log Events for a list of error events that may trigger a significant log.
Errors can be omitted from the significant logs list by editing the analytics profile used by the virtual service.
Full Client Logs
In addition to significant logs, a virtual service may be configured to log all client connections or HTTP requests. The Full Client Logs option includes any significant logs, custom full log filters, and any logs generated by custom policies or DataScripts. By default, a new virtual service is configured to provide full client Logs for the first 30 minutes, then drop-down to a reduced logging level by capturing significant logs only. From the Analytics tab, full client logs may be enabled for the virtual service, either temporarily or permanently.
Full client log filters may also be specified for IP addresses or URIs, which is recommended when capturing important information from busy production systems. An additional level of logging is provided by enabling All Headers option in a client log filter. This option will capture all headers from the client and server within the logs. Keep in mind this may have significant impact on the size of the logs, as some applications send as much as 30 k within a single header. Even so, All Headers option is very useful for quick troubleshooting to see what each side of the connection is sending and receiving.
NSX Advanced Load Balancer pulls logs from the SEs and indexes them on the Controllers only when an administrator attempts to view full client logs for the virtual service or pool. This may take anywhere from a few seconds to hours to process. Logs will be viewable while the indexing process is performed in the background. This time may depend on network latency from the SEs to the Controllers, the volume of logs, and the hardware used by the Controller for performing the resource-intensive task of indexing the data.
Note: NSX Advanced Load Balancer’s treatment of SE log data was different from the above-described on-demand behavior. Significant logs were pro-actively offloaded on a regular basis to the Controllers for indexing. Users preferring that approach should refer to this FAQ article.
Rotation Out of Unrequested Logs
Capturing all logs can consume significant resources. For this reason, logs that are unrequested are rotated out of the SE’s storage after a period of time. The allocation for raw log storage on an SE is variable, but a minimally configured SE with two vCPUs, two GB memory, and 10 GB storage can store about eight million logs. Adding more resources (CPU, memory, and especially disk space) to the Controllers and SEs will extend both the volume of logs per second and the length of time that Vantage can store the logs.
Logging During Heavy Load
In a very busy system with high volumes of requests per second, NSX Advanced Load Balancer may temporarily degrade to capturing only a sampling of requests. If the system is set up with redundant Controllers, the task of indexing logs for multiple virtual services is automatically shared across the Controllers to better utilize resources.
Client User IDs
User IDs for a virtual service are incorporated into UI displays when an auth profile is attached to the virtual service. To achieve this,
- Enable Basic HTTP Authentication in the virtual service config (Edit VS > Advanced).
- Configure and attach an auth profile to the virtual service.
Refer to the following for more details:
- HTTP Basic Authentication section of Create a Virtual Service article
- Auth Profile article
- HTTP Authentication Settings section of the LDAP Authentication article
Log Navigation
To access the client logs for a virtual service:
-
Navigate to Applications > Virtual Services.
-
Click on the virtual service name.
-
Click Logs tab to view the virtual service logs.
Note: Starting with NSX Advanced Load Balancer version 22.1.3, the old log view is visible by default. You can revert to the updated view from My Account Settings.
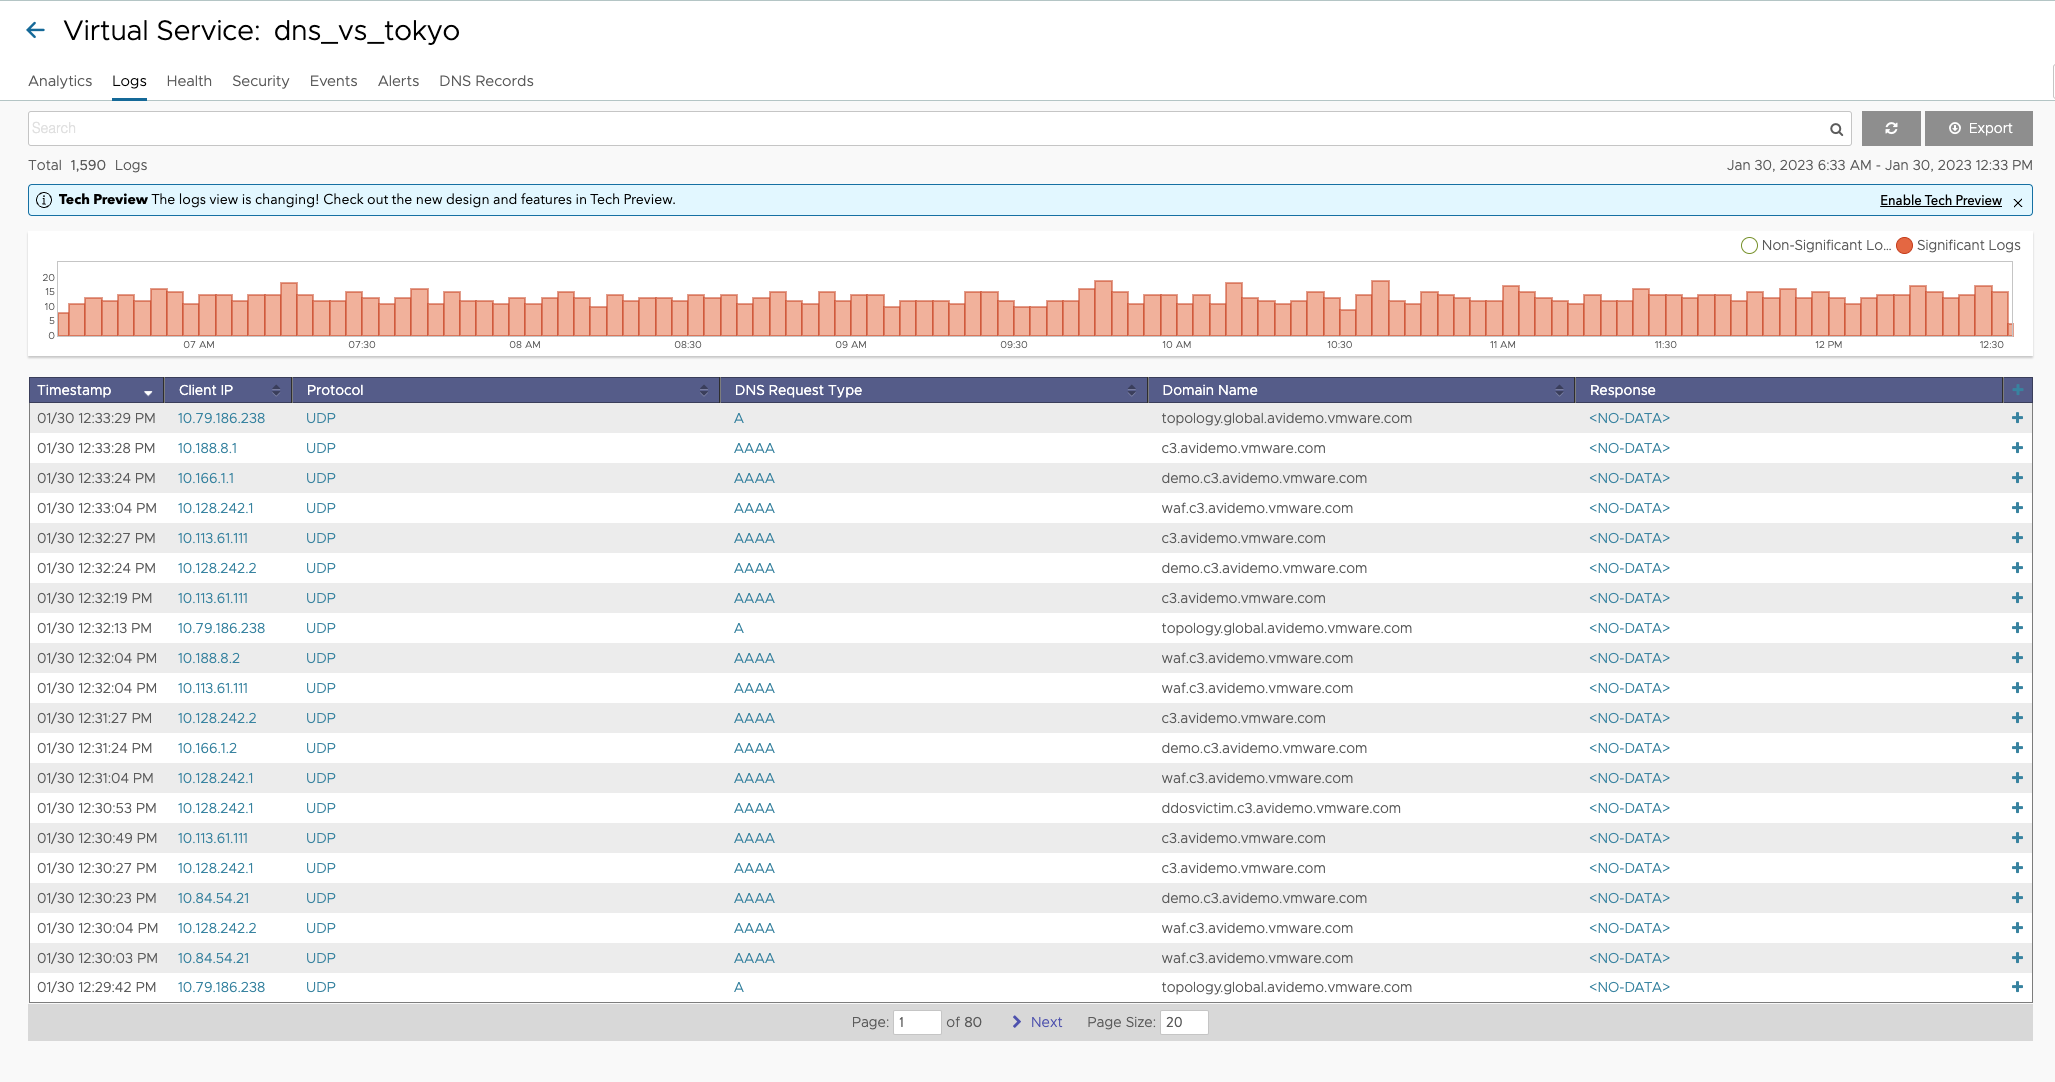
To go back to the new log view, click Enable Tech Preview, the following screen is displayed:
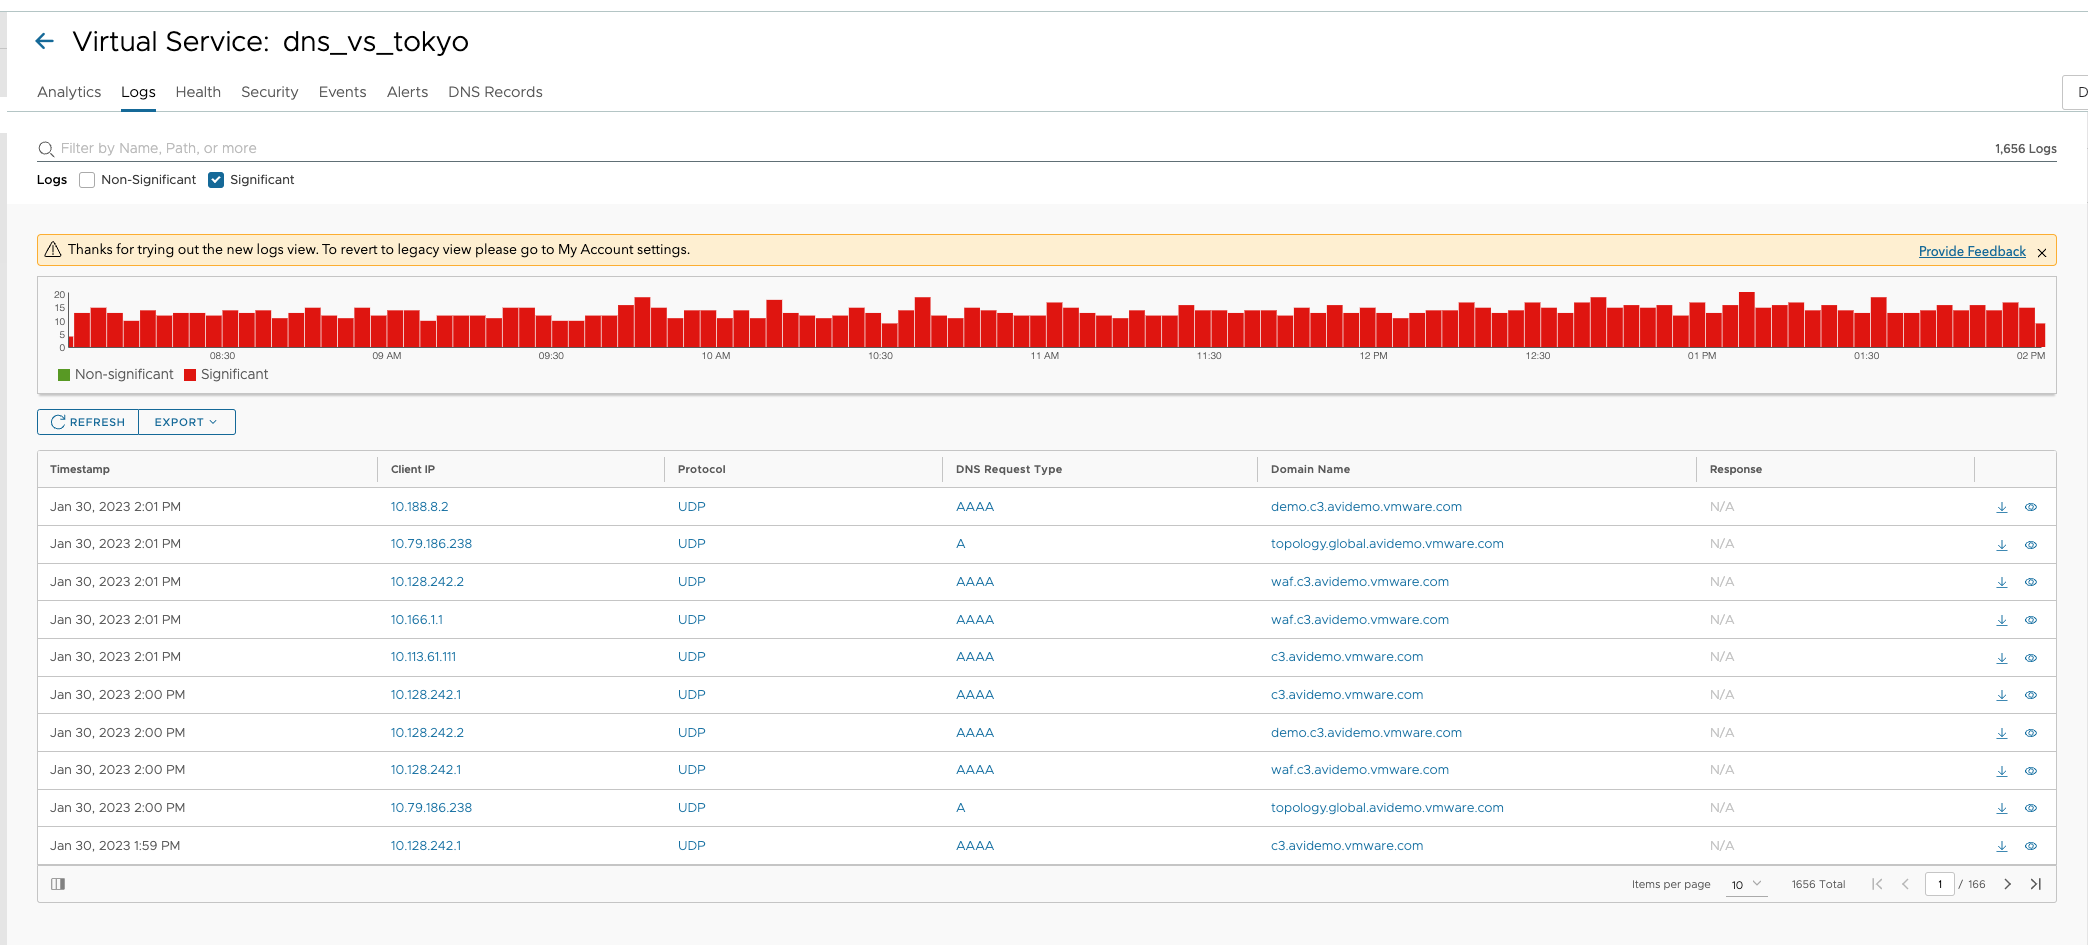
The top of the Client Logs tab displays the following items:
- Search: Filters the log entries using free-form text, keywords and/ or a formal search syntax.
- Refresh: Updates the logs for the currently-selected time period.
- Export: Download the logs directly from NSX Advanced Load Balancer. The logs are in comma-separated value (CSV) format. The downloaded file will include only the logs that match any custom filters, the Non-Significant logs versus Significant logs option, and the selected time period. This may include only the logs from the displayed page or all logs that match the filter, up to a maximum of 10,000 logs.
- Items per page: Total number of log items being displayed. The number will reflect how many logs passed the filter, which may be lower than the total number of logs.
- Clear Selected: Clears the filters that are added to the Search field.
- Histogram: Shows the number of client log entries over the selected time period. The X-axis is time, while the Y-axis is the number of logs.
- Green bars represent all non-significant logs, or successful transactions.
- Red bars represent errors, or significant logs.
Hovering the cursor over a single Histogram bar brings up a hover tooltip with the log count represented by that bar.
Click and drag inside the histogram to create a blue translucent overlay, with a magnifying glass icon in the center. This will define a new set of start and end times/dates, which will refresh the table below with these duration parameters. Clicking the blue magnifying glass icon in the overlay will zoom the Histogram to that view.
The primary table on the Logs tab displays the list of individual log entries. The following information appears for each log entry:
- Timestamp: Date and time the event occurred.
- WAF: WAF status, such as, Passed, Flagged, Rejected or By Passed.
-
Client IP: The source IP address of the client to which the log entry applies.
Note: Client IP is subject to the option
Use_True_Client_IP. Client IP might be equal to source IP from layer-3 header or equal to the fetched IP from user-defined HTTP header. For more information refer to True Client IP in L7 Security Features. - URI: For HTTP enabled virtual services, the URI path of the request, such as /index.html.
- Request: Type of HTTP method for the request, such as GET, POST, or HEAD.
- Response: For HTTP, the response code will be of type 1xx, 2xx, 3xx, 4xx, or 5xx. This is usually a reflection of the response sent by the server, but it may instead be a response created by NSX Advanced Load Balancer. Expand the log to determine whether the server or NSX Advanced Load Balancer generated the response.
- Length: Size of the response, in Kilobytes.
- Duration: Bar showing the total transaction time, which can be used to compare this request to others based on the length of the bar. Hovering the mouse pointer over the bar shows a breakdown of time that makes up the duration of the request. This is a miniature version of the End to End Timing chart that appears when the log is expanded.
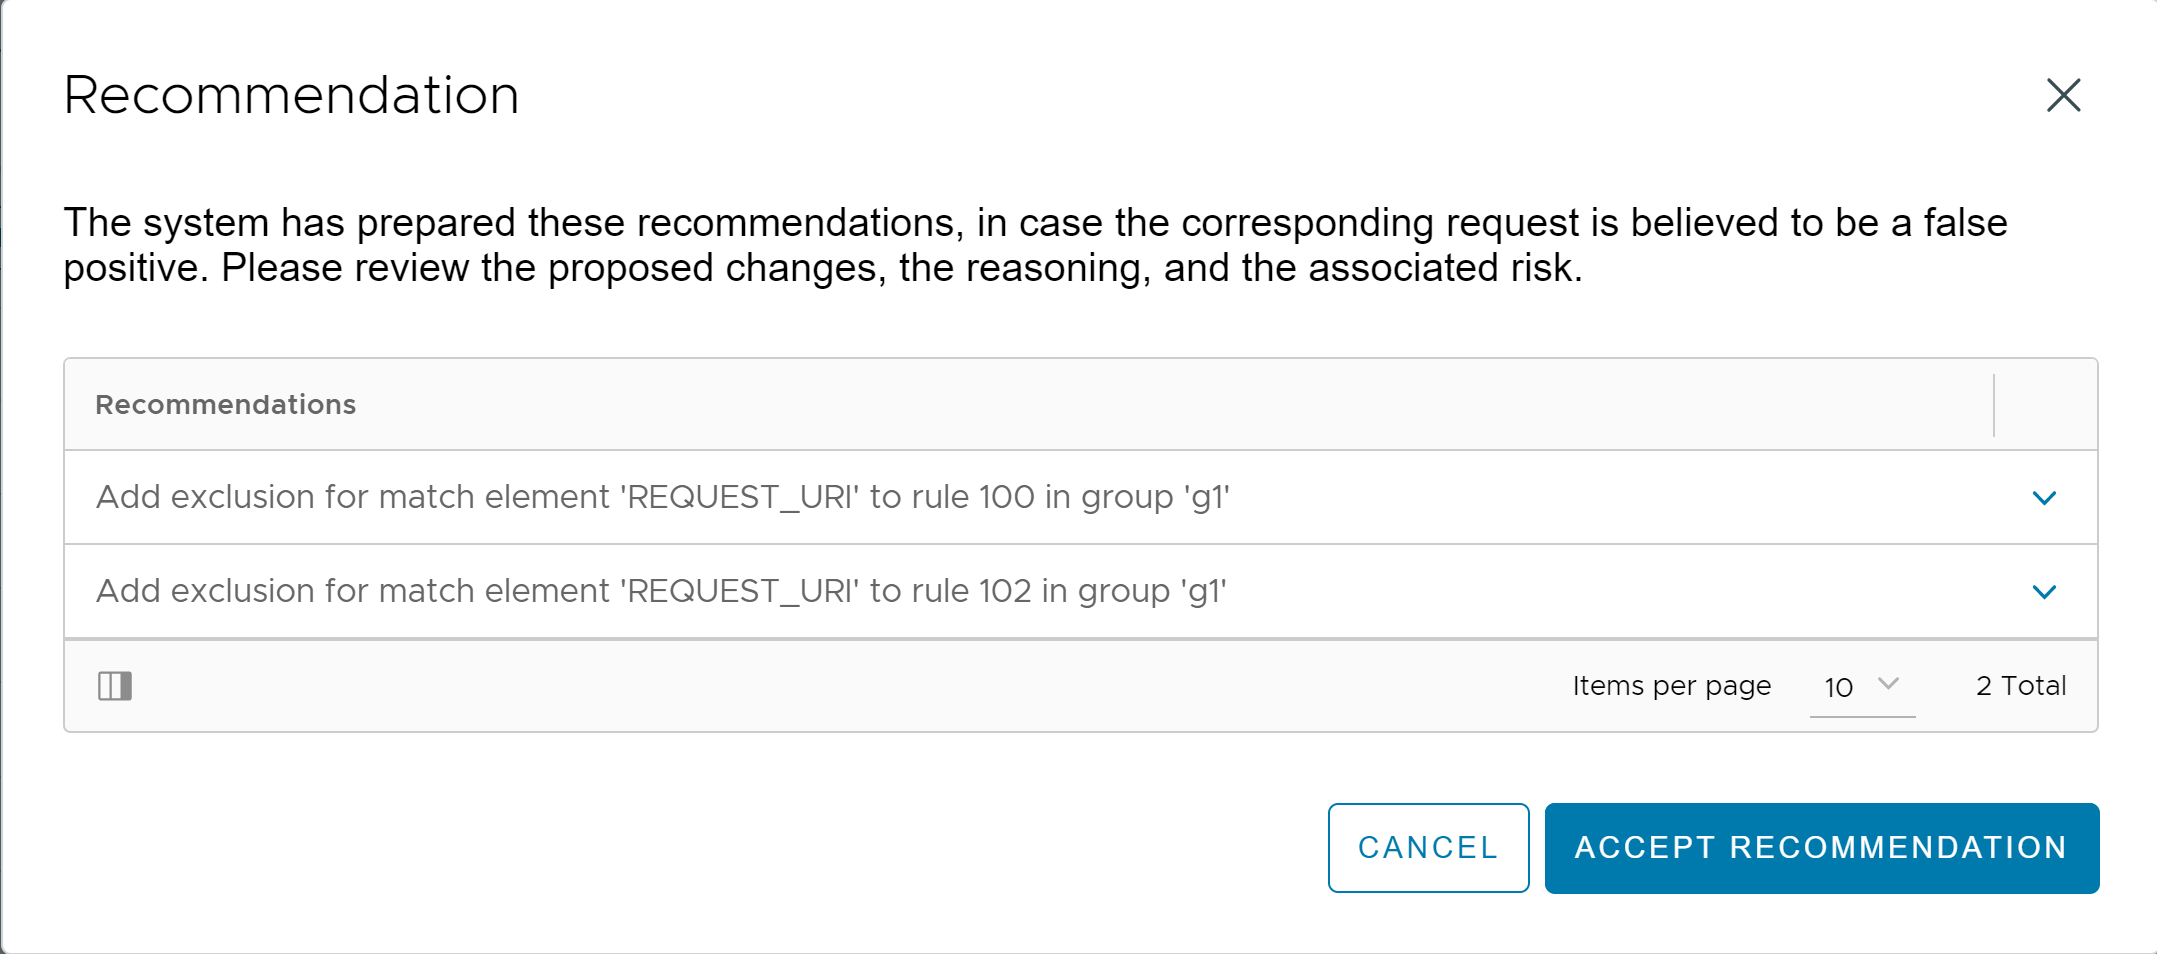
You can view the recommendations, download the logs and view the log details by clicking on the respective icons on the right-hand side of each log.
Timeouts: In the logs page, a timeout can occur, which means that the API has not returned all available logs data before a specified amount of time. You will see the following message:

Logs Analytics Section
Expand the right-hand-side to have an in-depth view of the specific connection log or the HTTP request and response log.
- WAF Analytics
- WAF Tags
- WAF Rules
- WAF Groups
- WAF Latency
- Client Analytics
- Browser: The web browser of the connecting device. HTTP only.
- Client OS: The client operating system.
- Device: The type of connecting device, such as computer, table, or phone. HTTP only.
- IP Addresses: Under End to End Timing, IP addresses and service ports indicate the client source address and port being used to initiate a transaction to the virtual service IP address and destination service port. The second address under the NSX Advanced Load Balancer icon is the NSX Advanced Load Balancer source NAT (SNAT) address and source port that is used for communicating with the destination server’s pool, name, IP address and port.
- Location: The country of origin for the IP address or Internal for private IP addresses. This field may also show custom IP group names.
- End to End: The bar is similar to the Analytics tab of the virtual service details page, though it also contains arrows indicating the HTTP response code. This data is specific to this single connection or HTTP request, whereas the Analytics tab for the virtual service shows an aggregate of all connections or requests. If the arrow under Server RTT is a 0, then no response was received from the server. This may be due to an error such as a timed out server response, or because the request was served by NSX Advanced Load Balancer, such as via caching or a policy.
- User ID: Most common user IDs.
- Load Balancer Analytics
- Policies
- VS IP Address
- Server IP Address: The list of the top servers. Add a filter such as
resp_code>=500to see which servers are responding with ‘server busy’ errors. - Service Engine: The SE and corresponding vCPU that was used to process the request or connection.
- Request Analytics
- SSL: The negotiated version, such as SSL 3.0, TLS 1.0, TLS 1.1, or TLS 1.2. SSL terminated HTTP traffic only.
- Referer: Top websites that have referred traffic, based on the HTTP Referer header.
- URL Path: The most commonly requested HTTP paths, such as /index.html. Try adding a filter for 404 to see the most common broken links on your website or a filter for response time greater than 500 to see which objects are taking the longest to generate by the servers.
-
- Host Header: The most common HTTP hosts (domain names) requested. This is most applicable in a forward proxy or virtual hosting.
- HTTP Version: The version of HTTP negotiated with the client. This may be 1.0, 1.1, or SPDY 3.1.
- Request Length: Size of the HTTP requests, in bytes. HEAD requests are typically very small, GETs tend to be a bit larger, and POSTs can be extremely large.
- Request Type: A breakdown of the various HTTP request methods, such as GET, POST, HEAD, CONNECT, PUT, and so on.
- Response Code: The HTTP responses sent from NSX Advanced Load Balancer or the servers. This can be 200, 301, 304, 404, 503, and so on. Adding the IP address of a suspect server to the filter can give you a better view of the typical responses that the selected server is sending out.
- Response Content Type: Types of content requested by clients.
- Response Length: Size distribution of HTTP responses sent to clients. This gives a good indication of the average HTTP response size.
- ICAP Analytics
- Action
- Latency
- ICAP Response Code
- HTTP Response Code
- Server IP
- Violation Resolutions
- Violation Threat Names
- Bot Analytics
- Classification
- Bot Client Type
- Identifier
- Component
- Bot Client Type
- Bot Client Class
- Confidence
- Identifier
- IP Reputation
- IP Location
- Significance Analytics
- Significance: If the connection or request is determined to be an error, it will be marked as Significant. This field provides a description of the issue (such as client terminated the connection or server returned 500 error).
Log Analytics
The Log Analytics area displays a series of prebuilt filters that summarize the client logs in a pop-up according to the selected summary filter.

The Log Summaries reflect the currently applied filters, including the displayed log period and the Non-Significant/ Significant setting.
Client information is learned from IP addresses or the client’s HTTP User-Agent string.
Adding a search filter such as client_location=”US” will filter the summaries to reflect only the results for clients coming from an IP address within the United States.
Log Analytics Tiles
The below section shows non-significant and significant details for L7 option. You can select L4 option or DNS option for their respective non-significant and significant details.
Non Significant Log
This section gives the cinematic view of the non-significant logs by clicking ‘eye’ icon on the right-hand side.
Significance Tab
This tab summarizes the end to end timing from client RTT to the Server RTT, application response time, the data transfer time. The following are the details covered:
- Client IP: The source IP address and service port of the client.
- Source Client IP: The source IP address and service port of the client.
- Virtual Service IP: The listening virtual service’s IP and port.
- Server Connection IP: The source IP address and port used as the source NAT address on the server side of the connection.
- Service Engine: The SE and corresponding vCPU that was used to process the request or connection.
- Server IP: The list of the top servers. Add a filter such as resp_code>=500 to see which servers are responding with ‘server busy’ errors.
- Significance: A log is classified as Significant if it has an entry in the Significant log field. This is generally due to an error, such as client or server reset, out of order packets, HTTP 4xx or 5xx.
Summary Tab
This tab provides details on the client, rules and policies, request information. The following are the details covered:
- Client
- Location: The country of origin for the IP address or Internal for private IP addresses. This field may also show custom IP group names.
- Operating System: The OS of the connecting device. HTTP only.
- Device: The type of connecting device, such as computer, table, or phone. HTTP only.
- Browser: The web browser of the connecting device. HTTP only.
- Start Time: The time the connection was established or the request was received.
- End time: When the log was generated; this normally occurs when the request or connection was completed; however, logs may be generated for currently active, long-lived connections. Logs generated during an open connection will be updated periodically or when the connection closes.
- Rules and Policies: If a policy has been applied to the virtual service, any rules that were executed will be displayed.
- Network Security Policy Rule
- HTTP Security Policy Rule
- HTTP Request Policy Rule
- HTTP Response Policy Rule
- Request Information
- Request ID
- Host: The HTTP Host header, such as www.avinetworks.com or 10.1.1.10.
- Request: The HTTP method (such as GET), version (such as HTTP/1.1), and size of the request (such as 2 Kb).
- URI: The HTTP path and query of the client request.
- User Agent: The raw client HTTP User-Agent header (such as Mozilla/5.0, AppleWebKit/533, and so on).
- Content Type: The HTML, images, Javascript, and so on returned to the client.
- Response Length: The size of the HTTP header plus content returned from the server to NSX Advanced Load Balancer (This may be different from the size of the response length from Vantage to the client due to compression, inserting JavaScript, or other acceleration that may alter the content size before it is sent to the client).
- GRPC Status
Application Tab
The following details are covered:
- HTTP2 Stream ID
- Server Push Initiated
- Server Pushed Request
- Cache Hit: This is true if the HTTP request was served by the NSX Advanced Load Balancer cache. This field will not be shown if caching is disabled.
- Compression: If NSX Advanced Load Balancer compresses the response content, this will show the percent by which the content was compressed.
- Number of Servers Tried
- Request: The HTTP method (such as GET), version (such as HTTP/1.1), and size of the request (such as 2 Kb).
Headers Tab
This tab records all client request and server response headers. Custom headers, cache control, and other useful troubleshooting may be done by viewing full headers. Headers may be quite large, which can come at the cost of a significant resource hit to the SEs creating the logs and the Controller storing the larger logs. Recommendation is to turn this feature on selectively, such as for specific clients or for a shorter time duration. The following details are covered:
- All Request
- Headers received from client
- Headers sent to server
- All Response
- Headers sent to client
Security Tab
This tab details the time consumed for request header, request body, response header and response body. You can also view the total memory consumed by WAF to process this request.
Note: Prior to NSX Advanced Load Balancer version 22.1.3, authentication and authorization related logs were stored in two files (portal-webapp.log , portal-auth.log). Starting with NSX Advanced Load Balancer version 22.1.3, all the authentication and authorization related logs are available in a single file (portal-auth.log) for easier debugging of issues related to authentication.
Searching Logs
The Search field above the list of client log entries filters the logs according to your specified search terms. You may use either arbitrary search strings or a specific search syntax. For example, entering “mobile” will filter the logs to all entries that include this string anywhere within the log. Search strings are not case-sensitive.
To use the formal search syntax, the search filter may be typed manually, or clicking any blue text within a log entry will generate the filter. For example, clicking Client IP creates “filterclient_ip=A.B.C.D” where A.B.C.D is the client’s IP address. In this example, the logs will be filtered to show only clients with that specific IP address.
When typing a search directly into the Search field, contextual help will show the available options. For instance, typing “client_ip” will show the appropriate operands (described below) such as “ = “.
Example: The filter client_ip= will show the most commonly seen IP addresses, including the number of logs generated by these addresses and the percentage of logs from this address, in this format: 10.30.4.31 - 15924 - (34.7%)
When using the search syntax:
- Be aware of whether the log display filter is set to Significant Logs or Non-Significant Logs.
- Multiple filters may be selected or created to further refine a search. All filters must be true for the log to match.
- Search criteria for strings must be enclosed in quotation marks, such as client_country=”US” or”Connection setup failed”.
- The filter can include any combination of informal strings and formal search syntax, such as: iphone client_ip^=”10.30.”
- Searches may be saved and reused later.
- The following operators allow more granular searches for strings, numbers, or IP addresses:
- Greater than: >
- Greater than or equal: >=
- Less than: <
- Less than or equal: <=
- Not equal: !=
- Equals: =
- Contains: ~=
- Does not contain: !~=
- Starts with: ^=
- Ends with: $=
Significant Log Events
NSX Advanced Load Balancer records the following types of significant log events for clients (grouped alphabetically by high-level description).
Notes: To appear on the Log tab for a virtual service, the display filter on the tab must be set to Significant Logs.
- Auth Error:
- authentication server connection error: Authentication server connection error
- authentication server did not recognize the user: Authentication server did not recognize the user
- user authentication failed due to unknown error: User authentication failed due to unknown error
- user authentication timed out: User authentication timed out
- user credentials failed: User credentials failed
- user login failed due to missing credentials: User login failed due to missing credentials
- user not authorized for access: User not authorized for access
- Client certificate verification failed:
- CA x509 certificate invalid: CA’s x509 certificate is invalid
- CRL error: Client’s x509 certificate CRL had error
- CRL has expired: Client’s x509 certificate CRL has expired
- CRL not yet valid: Client’s x509 certificate CRL not yet valid
- Unable to get CRL for a certificate: Client’s x509 certificate CRL not present
- certificate chaining error: Certificate chain could not be formed correctly
- client x509 certificate expired: Client’s x509 certificate has expired
- client x509 certificate had errors: Client’s x509 certificate has errors
- client x509 certificate not yet valid: Client’s x509 certificate not yet valid
- client x509 certificate revoked: Client’s x509 certificate has been revoked
- client x509 certificate verification failed: Validation of the client’s x509 certificate failed
- internal error: Internal Error
- Client request processing failure:
- internal failure: NSX Advanced Load Balancer was unable to complete UDP request from the client due to an internal error. This may be due to lack of memory or other resources.
- server conn setup failed: NSX Advanced Load Balancer was unable to complete UDP request from the client due to an internal error setting up server connectivity. This may be due to lack of memory or other resources.
- Connection abnormal event:
- HTTP Server took longer than configured threshold to respond: HTTP Server took longer than configured threshold to respond
- HTTP Server took longer than configured time to respond: HTTP Server took longer than configured time to respond
- TCP Server took longer than expected to respond: TCP Server took longer than expected to respond
- can’t resolve server address: Can’t resolve server address
- client high retransmits: The TCP connection completed gracefully, but there were a high number of retransmitted packets from NSX Advanced Load Balancer to the client. This may be due to a lossy or congested network.
- client high rtt: The TCP round trip time between NSX Advanced Load Balancer and the client is greater than 1 second.
- client out of order packets: The TCP connection completed gracefully, but NSX Advanced Load Balancer received a high number of out of order packets from the client. This is generally due to lossy or congested network or drops by Avi.
- client possible window stuck: The TCP connection completed gracefully, but there were instances when the TCP window advertised by the client was not opened fast enough, which may lead the window to be stuck.
- client timeout caused retransmits: The TCP connection completed gracefully, but there are a high number of retransmitted packets due to timeouts from NSX Advanced Load Balancer to the client. This could be due to lossy network or a slow client.
- request timed out while waiting for client: Request timed out while waiting for client
- server high retransmits: The TCP connection completed gracefully, but there were a high number of retransmitted packets from NSX Advanced Load Balancer to the server. This may be due to a lossy or congested network.
- server high rtt: The TCP round trip time between NSX Advanced Load Balancer and the server is greater than 500ms.
- server out of order packets: The TCP connection completed gracefully, but NSX Advanced Load Balancer received a high number of out of order packets from the client. This is generally due to lossy or congested network or drops by Avi.
- server possible window stuck: The TCP connection completed gracefully, but there were instances when the TCP window advertised by the server was not opened fast enough, which may lead the window to be stuck.
- server timeout caused retransmits: The TCP connection completed gracefully, but there were a high number of retransmitted packets due to timeouts from NSX Advanced Load Balancer to the server. This could be due to lossy network or a slow server.
- server udp response timed out: Server response to client’s udp packet timed out.
- server unanswered syns: The TCP connection completed gracefully, but there were some syns sent to backend server were not acked immediately that caused SE to retransmit the syn. This is typically due to busy server.
- zero window from client: The TCP connection completed gracefully, but there were instances when the TCP window advertised by the client depleted to zero. This means that NSX Advanced Load Balancer cannot send any more packets until the client opened the TCP window. This is typically due to a slow client.
- zero window from server: The TCP connection completed gracefully, but there were instances when the TCP window advertised by the server depleted to zero. This means that NSX Advanced Load Balancer cannot send any more packets until the server opened the TCP window. This is typically due to a slow server.
- zero window to client: The TCP connection completed gracefully, but there were instances when the TCP window advertised by NSX Advanced Load Balancer to client depleted to zero. This means that client cannot send any more packets until NSX Advanced Load Balancer opened the TCP window. This is typically due to a slow server.
- zero window to server: The TCP connection completed gracefully, but there were instances when the TCP window advertised by NSX Advanced Load Balancer to server depleted to zero. This means that server cannot send any more packets until NSX Advanced Load Balancer opened the TCP window. This is typically due to a slow client.
- Connection closed abnormally:
- Connection was closed before client sent HTTP request: The connection was closed while waiting for the client to send HTTP request.
- client aborted connection: Client abnormally terminated the connection by sending a TCP RST.
- client connection timed out: The established TCP connection with the client was closed due to timeout. Despite multiple retry attempts, the client stopped responding to Avi’s packets.
- client prematurely closed SPDY stream: Client prematurely closed SPDY stream
- conn deleted due to config update: The connection was deleted due to an NSX Advanced Load Balancer configuration update.
- connection dropped due to SSL handshake failure: The connection dropped due to SSL handshake failure.
- connection dropped due to server side SSL handshake failure: The connection dropped due to server side SSL handshake failure.
- connection idle timed out: The established TCP connection was closed due to the TCP profile’s idle timeout.
- connection was closed by HTTP policy action: The connection was reset due to a close action in HTTP security policy on the VS.
- connection was closed by HTTP policy rate-limit action: The connection was reset due to a close action in HTTP security policy while rate-limiting flows on VS
- connection was closed by Datascript: The connection was reset by a Datascript installed by user
- connection was closed due to internal error: The connection was closed due to internal error.
- connection was closed on VS config update: The client connection is closed if vs has close_client_conn_on_config_update enabled and a disruptive config update is done on the virtual server.
- connection was closed while trying to find the configured tokens in URL: The connection was reset on failure to find configured tokens in url
- connection was prematurely closed by the client: connection was prematurely closed by the client.
- server aborted connection: Server abnormally terminated the connection by sending a TCP RST.
- server connection timed out: The established TCP connection with the server was closed due to timeout. Despite multiple retry attempts, the server stopped responding to Avi’s packets.
- server x509 certificate verification failed: Validation of the server’s x509 certificate failed.
- timed out waiting for HTTP request from client: The connection timed out waiting for the client to send HTTP request.
- Connection not allowed:
- Too many connections: Configured rate limiting action taken for this connection for this virtual service.
- Too many connections from this client IP: Configured rate limiting action taken for this connection from this client IP.
- Connection setup failed:
- client aborted connection setup: The connection setup was aborted by the client, which sent a RST during the TCP three-way handshake.
- client conn setup failed: NSX Advanced Load Balancer was unable to complete the TCP three-way handshake with the client due to an internal error. This may be due to lack of memory or other resource.
- client conn setup failed with bad packet: The connection was dropped due to bad packets received from client during TCP three-way handshake.
- client conn setup timed out: TCP three-way handshake with the client timed out despite multiple retries.
- server conn setup failed: NSX Advanced Load Balancer was unable to complete the TCP three-way handshake with the server due to an internal error. This may be due to lack of memory or other resource.
- server conn setup timed out: TCP three-way handshake with the server timed out despite multiple retries.
- server refused connection: The connection setup was refused by the server that sent RST during the TCP three-way handshake.
- DNS query:
- policy drop: NSX Advanced Load Balancer was unable to serve the DNS Query received from the client, since a configured policy has dropped the DNS query
- DNS query failed:
- DNS query for an excluded domain: NSX Advanced Load Balancer was unable to serve the DNS Query received from the client, since the query was destined to an excluded domain
- global service down: NSX Advanced Load Balancer was unable to serve the DNS Query received from the client, since the global service was down
- invalid DNS query: NSX Advanced Load Balancer was unable to serve the DNS Query received from the client, since the query was malformed or invalid
- no configured service found: NSX Advanced Load Balancer was unable to serve the DNS Query received from the client, since there was no configured service
- no valid global service member found: NSX Advanced Load Balancer was unable to serve the DNS Query received from the client, since no valid global service member was found
- server returned error response: NSX Advanced Load Balancer received an error response from the server for the DNS query received from the client
- unsupported DNS query: NSX Advanced Load Balancer was unable to serve the DNS Query received from the client, since the query type was not supported
- DOS_APP_ERROR:
- bad gateway: Potential denial of service attack where a backend network vulnerability is being exploited.
- gateway timeout: Potential denial of service attack where a backend network vulnerability is being exploited.
- DOS_HTTP_ABORT:
- client reset connection abnormally: Potential denial of service attack where client resets connection after having sent a few bytes of the request holding up request and connection related resources
- client reset the connection before sending any requests: Potential denial of service attack where client resets connections after having held up connection resources.
- DOS_HTTP_ERROR:
- bad request: Potential denial of service attack where client is sending bad requests.
- request body too large: Potential denial of service attack where client is sending requests with body size more than allowed by configuration.
- request ended prematurely: Potential denial of service attack where client closed the connection in the middle of a request.
- request header too large: Potential denial of service attack where client is sending requests with header size more than allowed by configuration.
- request uri too large: Potential denial of service attack where client is sending requests with uri length more than allowed by configuration.
- DOS_HTTP_TIMEOUT:
- connection timed out as no requests were received from the client after the connection was established: Potential denial of service attack where client holds up a connection without sending any requests. Browsers like Chrome are known to keep connections open for short durations of time without sending any requests, in which case this significance would not be triggered.
- request timed out: Potential denial of service attack where client is sending requests few bytes at a time with no intention of completing the request. This could potentially be Slowloris or Slowbody attack.
- DOS_SSL_ERROR:
- ssl error: Potential denial of service attack where client is causing SSL errors resulting in resources being exploited.
- Datascript Error:
- a datascript attached to the VS returned a 5xx response.: Datascript attached to the virtual service returned a 5xx response.
- Datascript error:
- a datascript attached to the VS returned a 4xx response: Datascript attached to the virtual service returned a 4xx response.
- HTTP2 Compression Error:
- Client sent header block with too long header index value: Client sent header block with too long header index value
- Client sent header block with too long size update value: Client sent header block with too long size update value
- Client sent header field with too long length value: Client sent header field with too long length value
- Client sent invalid HPACK table index - 0: Client sent invalid HPACK table index - 0
- Client sent invalid encoded header field: Client sent invalid encoded header field
- Client sent invalid table size update: Client sent invalid table size update
- Client sent out of bound HPACK table index: Client sent out of bound HPACK table index
- HTTP2 Flow Control Error:
- Client sent SETTINGS frame with incorrect INITIAL_WINDOW_SIZE value: Client sent SETTINGS frame with incorrect INITIAL_WINDOW_SIZE value.
- Client violated flow control for stream by sending WINDOW_UPDATE frame with window increment disallowed for window: Client violated flow control for stream by sending WINDOW_UPDATE frame with window increment disallowed for window
- Received DATA frame length from client violated connection’s available window size: Received DATA frame length from client violated connection’s available window size
- Received DATA frame length from client violated stream’s available window size: Received DATA frame length from client violated stream’s available window size
- Send Window larger than allowed: Send Window larger than allowed
- HTTP2 Frame Size Error:
- Client sent GOAWAY frame with incorrect length: Client sent GOAWAY frame with incorrect length
- Client sent HEADERS frame with empty header block: Client sent HEADERS frame with empty header block
- Client sent HEADERS frame with incorrect length: Client sent HEADERS frame with incorrect length
- Client sent PING frame with incorrect length: Client sent PING frame with incorrect length
- Client sent PRIORITY frame with incorrect length: Client sent PRIORITY frame with incorrect length
- Client sent RST_STREAM frame with incorrect length: Client sent RST_STREAM frame with incorrect length
- Client sent SETTINGS frame with ACK flag and nonzero length: Client sent SETTINGS frame with ACK flag and nonzero length
- Client sent SETTINGS frame with incorrect length: Client sent SETTINGS frame with incorrect length
- Client sent header block with incorrect length: Client sent header block with incorrect length
- client exceeded compressed header size limit: Client exceeded compressed header size limit
- client exceeded header size limit: Client exceeded header size limit
- HTTP2 Miscellaneous Error:
- Client prematurely closed connection: Client prematurely closed connection
- Client prematurely closed stream: Client prematurely closed stream
- Negative window update: HTTP2 Negative window update
- HTTP2 Protocol Error:
- Client intended to send body data larger than declared: Client intended to send body data larger than declared
- Client intended to send too large chunked body: Client intended to send too large chunked body
- Client sent CONTINUATION frame with incorrect identifier: Client sent CONTINUATION frame with incorrect identifier
- Client sent HEADERS frame for stream with incorrect dependency: Client sent HEADERS frame for stream with incorrect dependency
- Client sent HEADERS frame with incorrect identifier: Client sent HEADERS frame with incorrect identifier
- Client sent PRIORITY frame with incorrect dependency: Client sent PRIORITY frame with incorrect dependency
- Client sent PRIORITY frame with incorrect identifier: Client sent PRIORITY frame with incorrect identifier
- Client sent PUSH PROMISE frame: Client sent PUSH PROMISE frame
- Client sent RST_STREAM frame with incorrect identifier: Client sent RST_STREAM frame with incorrect identifier
- Client sent SETTINGS frame with incorrect MAX_FRAME_SIZE: Client sent SETTINGS frame with incorrect MAX_FRAME_SIZE
- Client sent WINDOW_UPDATE frame with incorrect length: Client sent WINDOW_UPDATE frame with incorrect length
- Client sent WINDOW_UPDATE frame with incorrect window increment 0: Client sent WINDOW_UPDATE frame with incorrect window increment 0
- Client sent duplicate :method header: Client sent duplicate :method header
- Client sent duplicate :path header: Client sent duplicate :path header
- Client sent duplicate :scheme header: Client sent duplicate :scheme header
- Client sent empty :method header: Client sent empty :method header
- Client sent empty :path header: Client sent empty :path header
- Client sent empty :scheme header: Client sent empty :scheme header
- Client sent header with invalid value: Client sent header with invalid value
- Client sent inappropriate frame while CONTINUATION frame was expected: Client sent inappropriate frame while CONTINUATION frame was expected
- Client sent invalid :method header: Client sent invalid :method header
- Client sent invalid :path header: Client sent invalid :path header
- Client sent invalid DATA frame with incorrect frame length - 0: Client sent invalid DATA frame with incorrect frame length - 0
- Client sent invalid header: Client sent invalid header
- Client sent invalid header name: Client sent invalid header name
- Client sent no :method header: Client sent no :method header
- Client sent no :path header: Client sent no :path header
- Client sent no :scheme header: Client sent no :scheme header
- Client sent padded DATA frame with incorrect frame length: Client sent padded DATA frame with incorrect frame length
- Client sent padded HEADERS frame with incorrect frame length: Client sent padded HEADERS frame with incorrect frame length
- Client sent unexpected CONTINUATION frame: Client sent unexpected CONTINUATION frame
- Client sent unknown pseudo-header: Client sent unknown pseudo-header
- Client timed out: Client timed out
- Invalid connection preface received: Invalid connection preface received
- Proxy protocol error: Proxy protocol error
- HTTP2 Refused Stream Error:
- Client sent stream with data before settings were acknowledged: Client sent stream with data before settings were acknowledged
- Concurrent streams exceeded: Concurrent streams exceeded
- HTTP2 Stream Error:
- Client sent data on a half-closed stream: Client sent data on a half-closed stream
- Memory Exhausted:
- system memory exhausted: NSX Advanced Load Balancer was unable to process packets due to system memory exhaustion
- Persistence Error:
- cookie key is not in the list of keys configured in the persistence profile: Cookie key is not in the list of keys configured in the persistence profile
- persistence Profile Keys were not configured: Persistence Profile Keys were not configured
- request was intended for a remote site, but remote site was down: Request was intended for a remote site, but remote site was down
- Request abnormal event:
- RUM module cannot handle HTTP request method: RUM can only handle GET and POST. Incoming request method isn’t one of them.
- client attempted to request a different server name: Client attempted to request a server name that was different from the one that was negotiated.
- client sent HTTP TRACE method which is currently not supported: Client sent HTTP TRACE method which is currently not supported
- client sent a HTTP 1.1 request without Host header: Client sent a HTTP 1.1 request without Host header
- client sent a URI which failed to parse: Failed to parse a URI received from the client
- client sent a request with version less than 1.0: Found invalid version less than 1.0 in request.
- client sent an invalid content length: Client sent an invalid content length
- client sent an invalid header line: The newline character was missing after the carriage returning a header line
- client sent an invalid host in the request line: Found an invalid host in the request line while parsing.
- client sent duplicate header: Among the list of headers sent by client, there was a duplicate
- client sent invalid chunked body: Client sent invalid chunked body
- client sent invalid header block while processing SPDY stream: Client sent invalid header block while processing SPDY stream
- client sent invalid host header: Host header sent by client is invalid
- client sent too long request or header: Client sent too long request or header
- client sent unknown transfer encoding: Client sent unknown transfer encoding
- cookie size in the incoming request was greater than the maximum possible size: Cookie size in the incoming request was greater than the maximum possible size
- cookie size in the incoming request was lesser than the minimum expected cookie size: Cookie size in the incoming request was lesser than the minimum expected cookie size
- cookie version in the incoming request does not match the expected version: Cookie version in the incoming request does not match the expected version
- data error while reading SPDY request body: Data error while reading SPDY request body
- encountered an invalid header during SPDY header parsing: Encountered an invalid header during SPDY header parsing
- error while processing SPDY data: Error while processing SPDY data
- high app response time: App response time greater than the configured threshold
- high total time: Total time greater than the configured threshold
- http version 0.9: Client sent request with HTTP Protocol version 0.9.
- no method or uri or protocol seen while constructing SPDY request: No method or uri or protocol seen while constructing SPDY request
- persistent server changed: Persistent server changed
- there was an error while reading client headers: There was an error while reading client headers
- Request ended abnormally:
- Datascript failed to execute: The datascript failed to execute.
- Throttled by the custom string-based rate limiter: Request dropped because there were too many requests that map to a custom string
- Throttled by the header-based rate limiter: Request dropped because there were too many requests that contain a header or cookie value
- Too many bad requests for this URI: Request dropped because there were too many bad requests for this URI
- Too many bad requests for this URI from this client IP: Request dropped because there were too many bad requests for this URI from this client IP
- Too many bad requests from this client IP: Request dropped because there were too many bad requests from this client IP
- Too many requests: Request dropped because there were too many requests for this virtual service
- Too many requests for a bad URI: Request dropped because there were too many requests for this bad URI
- Too many requests for an unknown URI: Request dropped because there were too many requests for this unknown URI
- Too many requests for this URI: Request dropped because there were too many requests for this URI
- Too many requests for this URI from this client IP: Request dropped because there were too many requests for this URI from this client IP
- Too many requests from a bad client IP: Request dropped because there were too many requests from this bad client IP
- Too many requests from an unknown client IP: Request dropped because there were too many requests from this unknown client IP
- Too many requests from this client IP: Request dropped because there were too many requests from this client IP
- no available servers: The connection attempt was reset due to no servers available. This may be because the server connection limits setting was reached, or all servers are in a down state.
- request failed to select pool: The request could not be fulfilled by any available pool
- request failed to use a virtual hosting virtual server: The request could not be fulfilled by any virtual server
- response code 4xx: A 4xx ‘client error’ HTTP response code was sent to the client.
- response code 5xx: A 5xx ‘server error’ HTTP response code was sent to the client.
- SIP Proxy Profile Timeout:
- connection idle timeout occurred, closing the connection: Proxy profile connection timeout occurred
- transaction timeout occurred, closing server side connection: Proxy profile transaction timeout occurred
- SIP client connectivity failed:
- client UDP port unreachable: ICMP port unreachable was received when server’s message was sent to the client. Either the client has closed the UDP port or duplicate client IP in the network.
- SIP error:
- Can not parse message from a client: Can not parse SIP message sent by a client
- Can not parse message from server: Can not parse SIP message sent by server
- Can not update SIP message: Can not update SIP message
- Either app transaction timeout or connection idle timeout occurred in middle of transaction: SIP request timed out
- Server sent a SIP message with unknown CallId header: Server sent a SIP message with unknown CallId header
- request failed: SIP request failed
- SIP server connectivity failed:
- server UDP port unreachable: ICMP port unreachable was received when client’s message was sent to the server. Either the server is not listening to UDP on the port or duplicate server IP in the network.
- SSL Error:
- bad change cipher spec: Change cipher spec is bad
- block cipher pad is wrong: Block Cipher Pad is wrong
- client SSL certificate verify error: Client SSL certificate verify error
- client sent a plain request on HTTPS port: Client sent a plain request on HTTPS port
- client sent no required SSL certificate: Client sent no required SSL certificate
- decryption failed or bad record mac: Decryption failed or Bad record MAC
- digest check failed: Digest check failed
- error in received cipher list: Received cipher list has an error
- excessive message size: Message size is excessive
- inappropriate fallback: Inappropriate fallback to a lower version
- length mismatch: Length mismatch was detected
- no ciphers passed: No ciphers were passed
- no ciphers specified: No ciphers were specified
- no compression specified: No compression was specified
- no shared cipher: No shared cipher
- parse tlsext: Error parsing tlsext
- record length mismatch: Mismatch in record length
- renegotiate ext too long: Renegotiate extentions were too long
- renegotiation encoding err: Error in renegotiation encoding
- renegotiation mismatch: Mismatch detected in renegotiation
- scsv received when renegotiating: SCSV was received when renegotiating
- sslv3 alert bad certificate: SSLv3 alert - Bad Certificate
- sslv3 alert bad record mac: SSLv3 alert - Record with incorrect MAC received
- sslv3 alert certificate expired: SSLv3 alert - Certificate expired
- sslv3 alert certificate revoked: SSLv3 alert - Certificate revoked
- sslv3 alert certificate unknown: SSLv3 alert - Certificate unknown
- sslv3 alert decompression failure: SSLv3 alert - Decompression Failure
- sslv3 alert handshake failure: SSLv3 alert - Handshake Failure
- sslv3 alert illegal parameter: SSLv3 alert - Illegal Parameter
- sslv3 alert no certificate: SSLv3 alert - No Certificate
- sslv3 alert unexpected message: SSLv3 alert - Unexpected Message
- sslv3 alert unsupported certificate: SSLv3 alert - Unsupported Certificate
- tlsv1 alert access denied: TLSv1 alert - Access denied
- tlsv1 alert decode error: TLSv1 alert - Decode error - Field out of specified range or message length incorrect
- tlsv1 alert decrypt error: TLSv1 alert - Decrypt error
- tlsv1 alert decryption failed: TLSv1 alert - Decryption failed
- tlsv1 alert export restriction: TLSv1 alert - Export Restriction
- tlsv1 alert insufficient security: TLSv1 alert - Ciphers not secure enough
- tlsv1 alert internal error: TLSv1 alert - Internal Error
- tlsv1 alert no renegotiation: TLSv1 alert - No Renegotiation
- tlsv1 alert protocol version: TLSv1 alert - Attempt to negotiate with unsupported protocol version
- tlsv1 alert record overflow: TLSv1 alert - Record Overflow
- tlsv1 alert unknown ca: TLSv1 alert - CA could not be located or Doesn’t match known, trusted CA
- tlsv1 alert user cancelled: TLSv1 alert - User Cancelled
- unexpected message: Unexpected message
- unexpected record: Unexpected record
- unknown alert type: Unknown alert type
- unknown protocol: Unknown protocol
- unsafe legacy renegotiation disabled: Unsafe legacy renegotiation is disabled
- wrong version number: Wrong version number
- Server certificate verification failed:
- CA x509 certificate invalid: CA’s x509 certificate is invalid
- CRL error: Server’s x509 certificate CRL had error
- CRL has expired: Server’s x509 certificate CRL has expired
- CRL not yet valid: Server’s x509 certificate CRL not yet valid
- Unable to get CRL for a certificate: Server’s x509 certificate CRL not present
- certificate chaining error: Certificate chain could not be formed correctly
- hostname did not match with upstream certificate: Hostname did not match with the upstream certificate
- internal error: Internal Error
- server x509 certificate expired: Server’s x509 certificate has expired
- server x509 certificate had errors: Server’s x509 certificate has errors
- server x509 certificate not yet valid: Server’s x509 certificate not yet valid
- server x509 certificate revoked: Server’s x509 certificate has been revoked
- server x509 certificate verification failed: Validation of the server’s x509 certificate failed
- Server connectivity failed:
- server udp port unreachable: ICMP port unreachable was received when client’s packet was sent to the server. Either the server is not listening to UDP on the port or duplicate server ip in the network.
- Upstream Error:
- data error while reading from server: Data error while reading from server
- WAF Match:
- WAF matched the transaction: WAF matched the transaction
- Bot Management:
- Classification: The Bot classification
- Bot Client Type: The client type
- Identifier: The Bot identifier You can also view the consolidated information by clicking on SHOW COMPONENTS button.
Additional Information
- How to Check Real Time Sessions on an SE
- How to view logs on NSX Advanced Load Balancer for a specific duration
Document Revision History
| Date | Change Summary |
|---|---|
| January 31, 2023 | Revamped the entire KB as per 22.1.3 release |