Troubleshooting Packet Latencies within SE
Overview
SE time flow tracker can track the network characteristics, processing time at key checkpoints and flag queuing delays in a packet journey through the network appliance.
CLI
Configuring Analytics Profile
The following are the configuration used in analytics profile:
> show analyticsprofile System-Analytics-Profile
..
| latency_audit_props                 |                           |
|   latency_audit_mode                | LATENCY_AUDIT_OFF         |
|   latency_threshold                 | 20 milliseconds           |
|   conn_est_audit_mode               | LATENCY_AUDIT_ON          |
|   conn_est_threshold                | 40 milliseconds           |
+-------------------------------------+---------------------------+
| Audit Properties | Default | Description |
|---|---|---|
latency_audit_mode |
LATENCY_AUDIT_OFF |
LATENCY_AUDIT_OFF - Default, no latency audit is performed. LATENCY_AUDIT_ON - Turn on the latency audit with statistics/ counters for flows/ packets breaching the configured threshold.LATENCY_AUDIT_ON_WITH_SIG - Turn on the latency audit, statistics are updated along with event and significant logs. |
latency_threshold |
20 msec | This enables tracking the dispatcher to proxy latency for each packet if latency_audit_mode is set to LATENCY_AUDIT_ON. This is the threshold above which events, significant logs and metrics are expressed if the per packet latency from dispatcher to proxy is too high. |
conn_est_audit_mode |
LATENCY_AUDIT_ON |
LATENCY_AUDIT_OFF -No connection establishment audit is performed. LATENCY_AUDIT_ON - Default, turn on the connection establishment audit with statistics/ counters for flows/ packets breaching the configured threshold.LATENCY_AUDIT_ON_WITH_SIG - Turn on the connection establishment audit, statistics are updated along with event and significant logs. |
conn_est_threshold |
40 msec | This enables tracking the TCP connection establishment time if conn_est_audit_mode is set to LATENCY_AUDIT_ON. This is the threshold for anomaly detection which is expressed as events, significant logs and metrics if this threshold is breached.se |
Notes:
- Currently,
latency_audit_filtersis supported only for TCP/IPV4. - Time Tracker is toggled off if the CPU Time Stamp Counter (TSC) is variant.
- Time Tracker Latency Audit now supports auditing egress latency.
Configuring latency_audit_filters in debug Virtual Service
The filters contain all the options offered by VS capture filters. However, latency_audit_filters are functionally independent of capture filters.
> debug virtualservice vs-1
..
[admin:vpr-ctrl1]: debugvirtualservice:latency_audit_filters>
cancel               Exit the current submode without saving
capture_ip           (submode)
capture_ipc          (submode)
do                   Execute a show command
dst_port_end         Destination Port range filter.
dst_port_start       Destination Port range filter.
eth_proto            Ethernet Proto filter.
ip_proto             IP Proto filter. Support for TCP only for now.
new                  (Editor Mode) Create new object in editor mode
no                   Remove field
save                 Save and exit the current submode
show_schema          show object schema
src_port             Source Port filter.
src_port_range_end   Source Port range end filter. If specified, the source port filter will be a range. The filter range will be between src_port and src_port_range_end.
tcp_ack              TCP ACK flag filter.
tcp_fin              TCP FIN flag filter.
tcp_push             TCP PUSH flag filter.
tcp_syn              TCP SYN flag filter.
watch                Watch a given show command
where                Display the in-progress object
Notes The followings are the changes introduced in NSX Advanced Load Balancer 22.1.1 version.
- Latency audit is now part of
se_Groupunderse_time_Tracker_properties. - SE TT latency audit (ingress / egress) is now independent of flow_type.
- Latency_audit_filters under debug
serviceengineare now deprecated. - App log and connection log for TT latency_audit is still controlled by a knob under analytics profile (the knob is ingress_sig_log). This is to allow logs generation behaviour to be tweaked independently on each virtual service.
Connection establishment audit is part of analytics_profile > timetracker_properties. TimeTracker has the following two components:
- se_time_tracker_properties (to audit SE-specific events and counters)
- time_tracker_properties (to audit virtual service/ANP-specific events and counters)
To check the SE time tracker properties, use the se_time_tracker_props option under the configure serviceenginegroup <se_group_name> command.
Below is the sample output for the SE time tracker properties.
| se_time_tracker_props                   |                                                         |
|   ingress_threshold                     | 4 milliseconds                                          |
|   egress_threshold                      | 4 milliseconds                                          |
|   ingress_audit_mode                    | SE_TT_AUDIT_ON_WITH_EVENT                               |
|   egress_audit_mode                     | SE_TT_AUDIT_ON_WITH_EVENT                               |
|   event_gen_window                      | 1 seconds                                               |
| grpc_channel_connect_timeout            | 15                                                      |
+-----------------------------------------+---------------------------------------------------------+
Use the configure analyticsprofile <profile_name> command and the time_tracker_properties option to check the time tracker properties for the selected analytics profile.
| time_tracker_props                              |                                                       |
|   fe_conn_est_audit_mode                        | TT_AUDIT_ON_WITH_SIG                                  |
|   fe_conn_est_threshold                         | 4 milliseconds                                        |
|   be_conn_est_audit_mode                        | TT_AUDIT_ON_WITH_SIG                                  |
|   be_conn_est_threshold                         | 4 milliseconds                                        |
|   ingress_sig_log                               | True                                                  |
+-------------------------------------------------+-------------------------------------------------------+
Below is the default values for the Time Tracker and SE Time Tracker properties.


Metrics and Logs
The framework supports metrics, events and logs. These are configurable.
Metrics at SE level

Metrics at VS level

Events
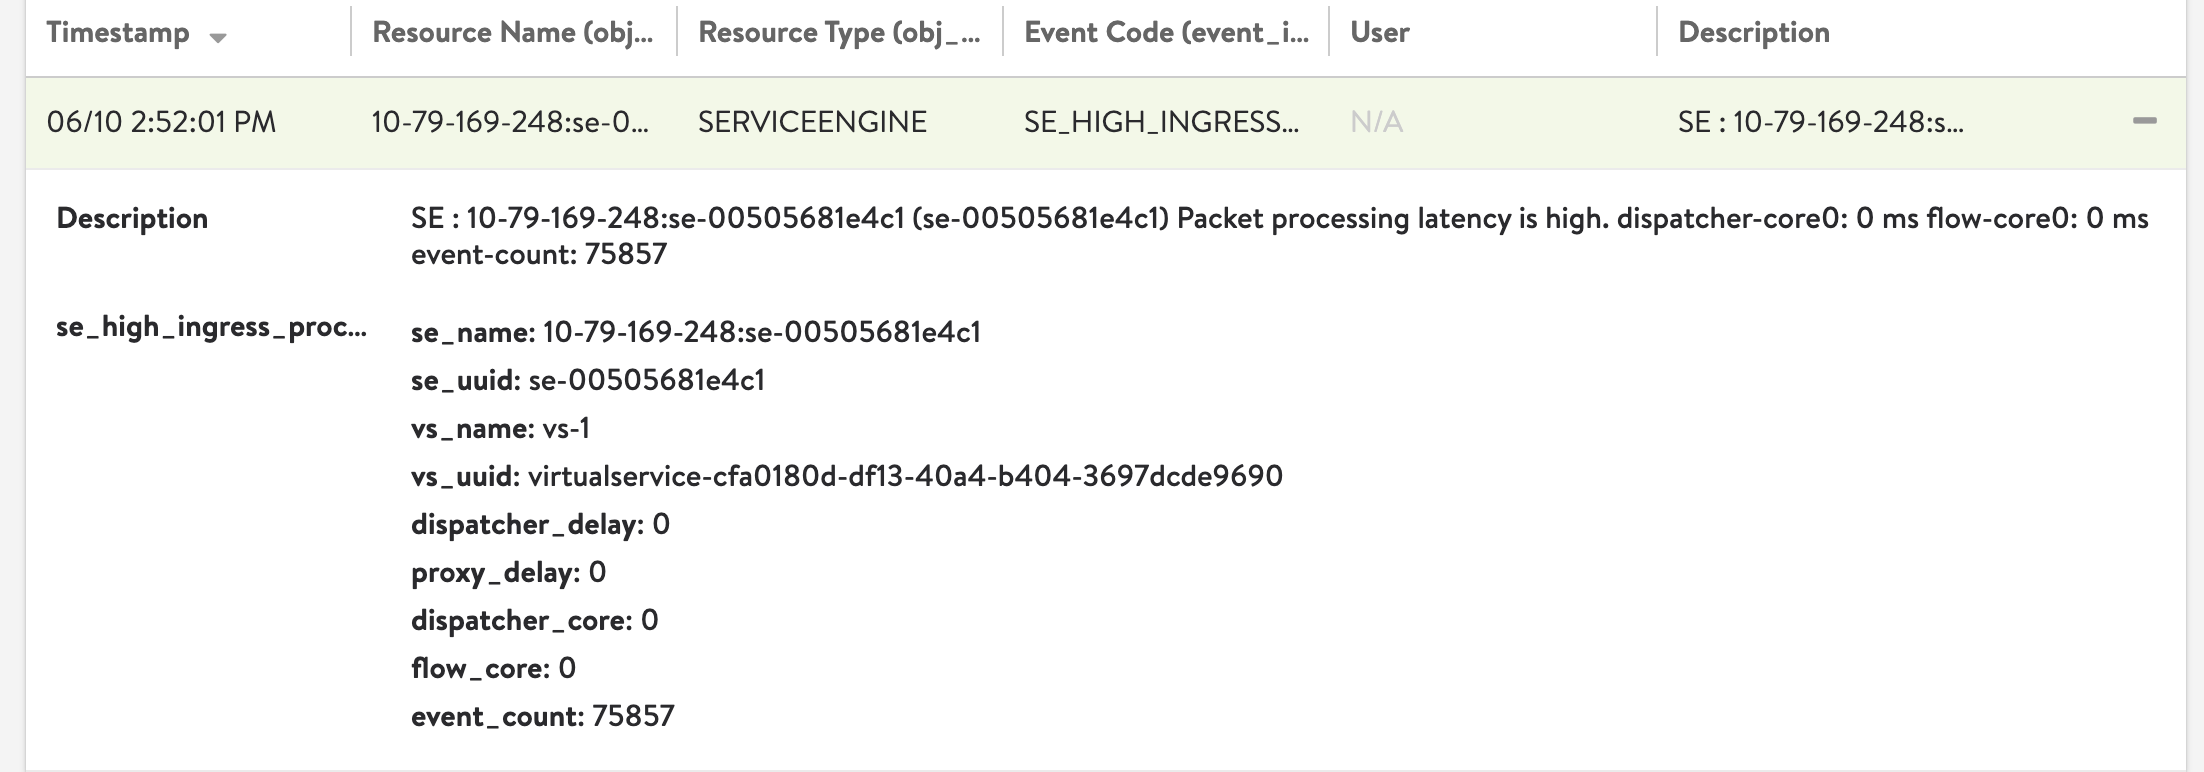
Note: The threshold is set to 0 in this example.
Significant Logs (When Latency_Audit is enabled)
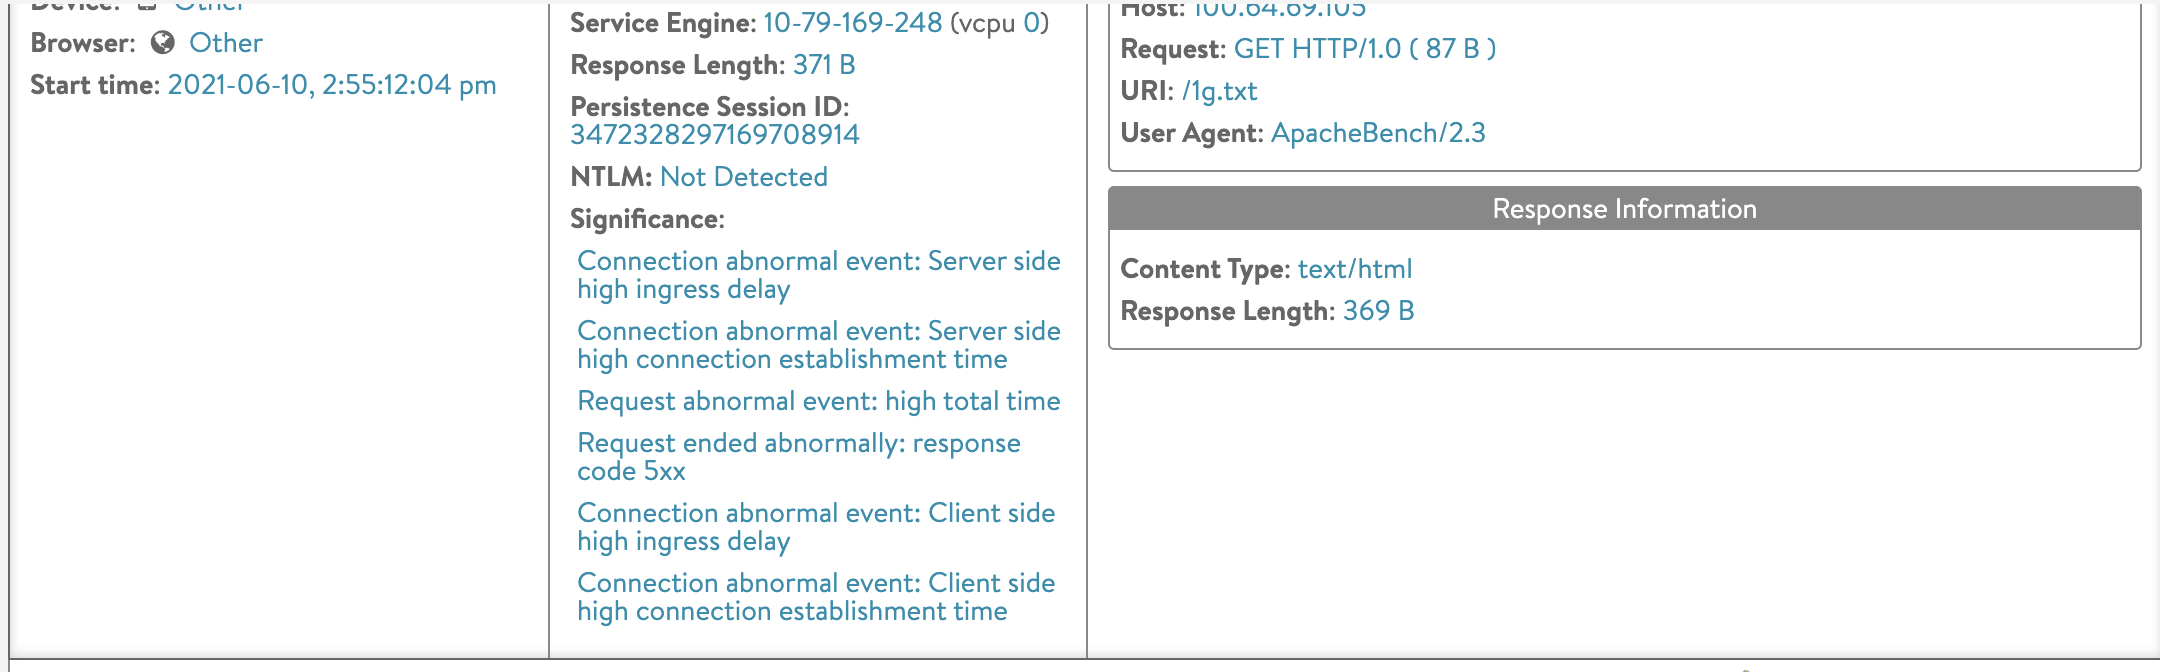
The detailed timing and flow characteristics will be present in Connection/App Log.
Key Changes Introduced in Avi Vantage 22.1.1 Version
The following are the changes introduced for the Events options in the NSX Advanced Load Balancer 22.1.1 version.
- TT Event generation option is now configurable under se_timetracker_properties.
- Virtual Service details is not supported under the TimeTracker Event.
- The maximum value of the ingress/egress latency (within an event window) is now published on the event log.
Use the show serviceengine <SE_NAME> rteringstat command to check Service Engine RteRingstats for Time Tracker :
| num_ingress_latency_exceeded_pkts | 12                        |
| num_egress_latency_exceeded_pkts  | 12                        |
Use the show virtualservice <VS_name> internal command to check the virtual service internal statistics for Time Tracker :
| num_ingress_latency_exceeded_flows  | 2                                                   |
| num_conn_est_time_exceeded_flows_fe | 1                                                   |
| num_conn_est_time_exceeded_flows_be | 1                                                   |