TCP Health Monitor
Overview
This article covers the specific configuration for TCP Health monitor type. Refer to Overview of Health Monitors article for general monitor information, implementation, and other monitor types.
For any TCP application, this monitor will wait for the TCP connection establishment, send the request string, and wait for the server to respond with the expected content. If no client request and server response are configured, the server will be marked ‘up’ from a successful TCP handshake completion.
Creating a TCP Health Monitor
To create a TCP health monitor,
-
From the NSX Advanced Load Balancer UI, navigate to Templates > Profiles > Health Monitors.
-
Click on Create to open the CREATE HEALTH MONITOR screen.
-
Under the General tab, enter the basic information about the health monitor. Note: Select the Type as TCP to view the TCP-specific settings.
-
Configure the TCP settings.
-
Configure the Server Maintenance Mode settings.
-
Configure Role-Based Access Control (RBAC).
-
Click Save to complete the health monitor creation.
Configuring General Settings
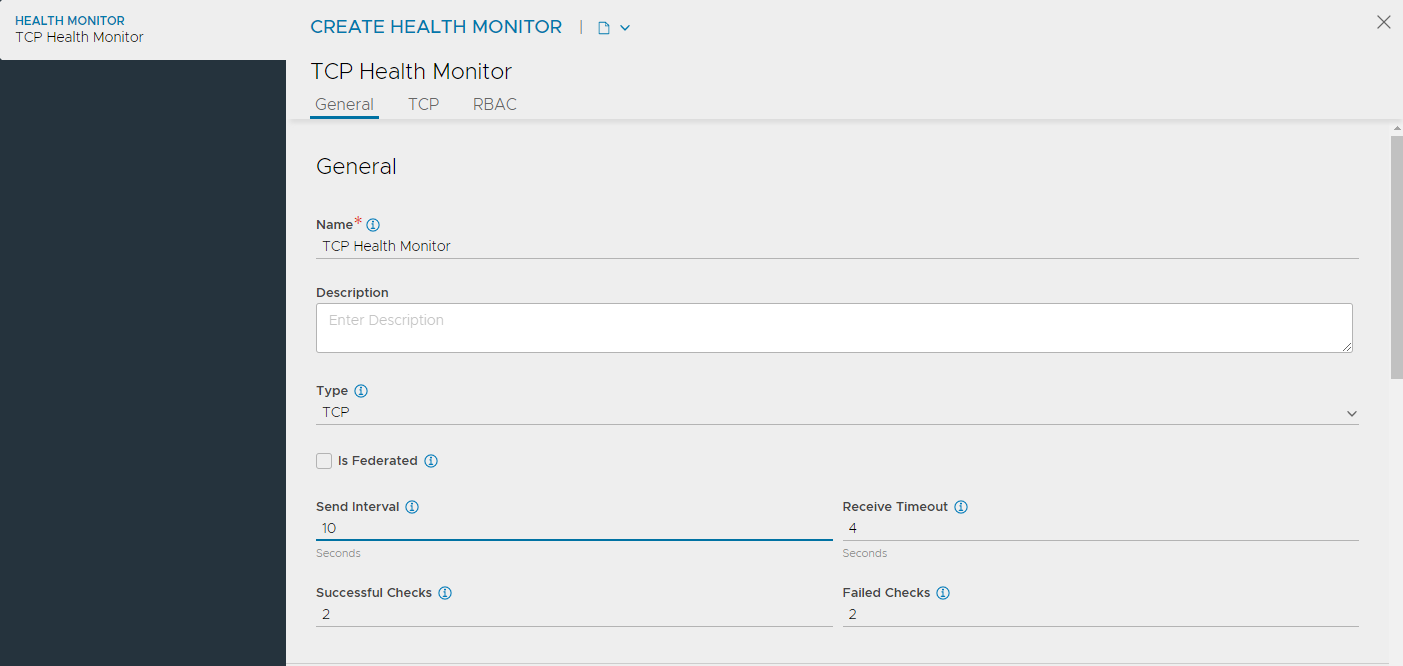
Under the General tab of the CREATE HEALTH MONITOR screen, configure the following:
-
Enter a unique Name for the monitor.
-
Enter a Description.
-
Select TCP as the Type of Health Monitor.
Note: Once the Type of Monitor is selected, options specific to the health monitor type are displayed. -
Select the option Is Federated? to replicate the object across the GSLB federation. When this option is not selected, the object is visible within the Controller-cluster and its associated SEs. This option is enabled only when GSLB is activated. A federated health monitor is used for GSLB purposes while it is not applicable for a regular (non-federated) health-monitor. A GSLB service cannot be associated with a regular (non-federated) health monitor, because GSLB service is a federated object, while the health monitor is not. Conversely, a pool cannot be associated with a federated health monitor because the pool is not a federated object.
-
Enter the Send Interval value (in seconds). This value determines how frequently the health monitor initiates an active check of a server. The frequency range is 1 to 3600.
-
Enter the Receive Timeout value (in seconds). The server must return a valid response to the health monitor within the specified time limit. The receive timeout range is 1 to 2400 or the send interval value minus 1 second.
Note: If the status of a server continually flips between up and down, this may indicate that the receive timeout is too aggressive for the server. -
Enter Successful Checks. This is the number of consecutive health checks that must succeed before NSX Advanced Load Balancer marks a down server as up. The minimum is 1, and the maximum is 50.
-
Enter Failed Checks. This is the number of consecutive health checks that on failing, NSX Advanced Load Balancer marks a server as down. The minimum is 1, and the maximum is 50.
Configuring TCP Settings
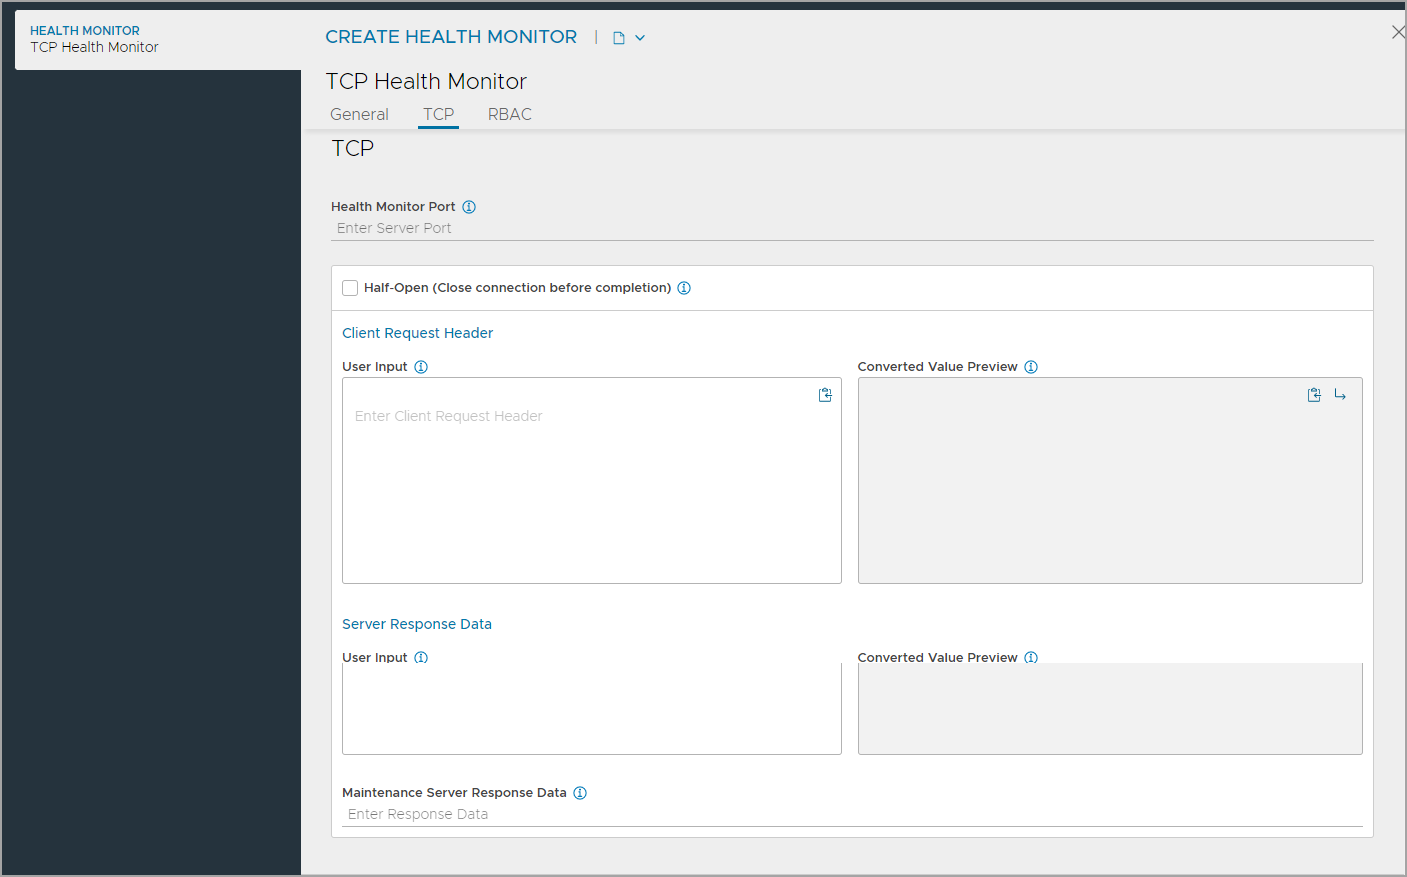
Under the TCP tab, configure the following:
-
Specify a Health Monitor Port that should be used for the health check. When this field is blank, the default port configured for the server will be used.
-
Enable Half-Open (Close connection before completion) for the health monitor to send a SYN. On receiving an acknowledgement, the server is marked up and the Service Engine responds with a RST. Since the TCP handshake is never fully completed, application health is not validated. The purpose of this monitor option is for applications that do not gracefully handle quick termination. By never completing the handshake, the application is not touched. No application logs are generated or app resources wasted setting up the a connection from the health monitor.
Note: Only if Half-Open (Close connection before completion) is not enabled, the Client Request Header and Server Response Data are available for configuration.
-
Use the section Client Request Header, enter an appropriate send string applicable for the server application. This request will be sent to the server immediately after completing the TCP three-way handshake.
-
In the section Server Response Data, enter the expected response from the server. NSX Advanced Load Balancer checks to see if the server response data is contained within the first 2KB of data returned from the server.
-
Under Maintenance Server Response Data enter the match for a keyword to find in the first 2kb of the server header and body response. If the defined string is seen in the server response, the server is placed in maintenance mode. The health checks will continue, and servers operate the same as if manually disabled, which means existing client flows are allowed to continue, but new flows are sent to other available servers. Once a server stops responding with the maintenance string, it will be noticed by the subsequent health monitors and will be brought online, being marked up or down as it normally would, based on the server response data. A manually disabled server does not receive health checks and is not automatically re-enabled.
See the Detecting Server Maintenance Mode for an example configuration.
Configuring RBAC
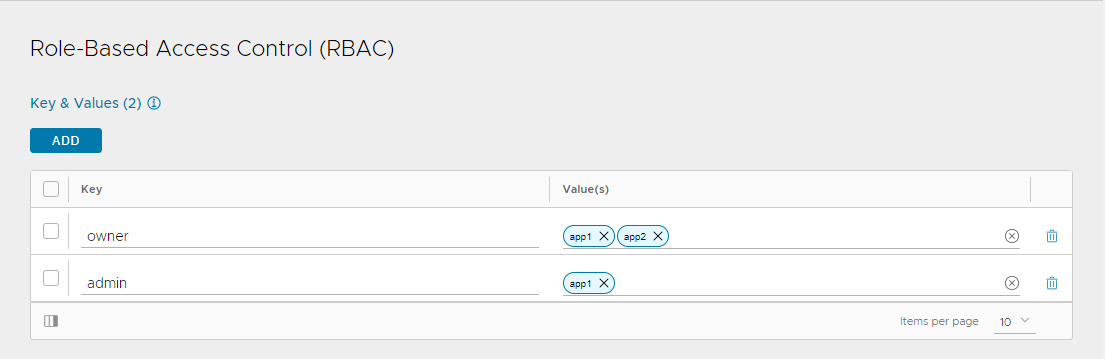
- Under the Role-Based Access Control (RBAC) section, configure labels to control access to the health monitor based on the defined roles:
- Click Add.
- Enter the Key and the corresponding values.
See Granular RBAC for more information.