HTTP Health Monitor
Overview
The HTTP health monitor can be applied to a pool whose virtual service has an HTTP application profile attached.
Creating an HTTP Health Monitor
To create an HTTP monitor,
-
From the NSX Advanced Load Balancer UI, navigate to Templates > Profiles > Health Monitors.
-
Click on Create to open the CREATE HEALTH MONITOR screen.
-
Under the General tab, enter the basic information about the health monitor. Note: Select HTTP to view the HTTP settings.
-
Configure the HTTP settings.
-
Configure the Server Maintenance Mode settings.
-
Configure Role-Based Access Control (RBAC).
-
Click Save to complete the HTTPS health monitor creation.
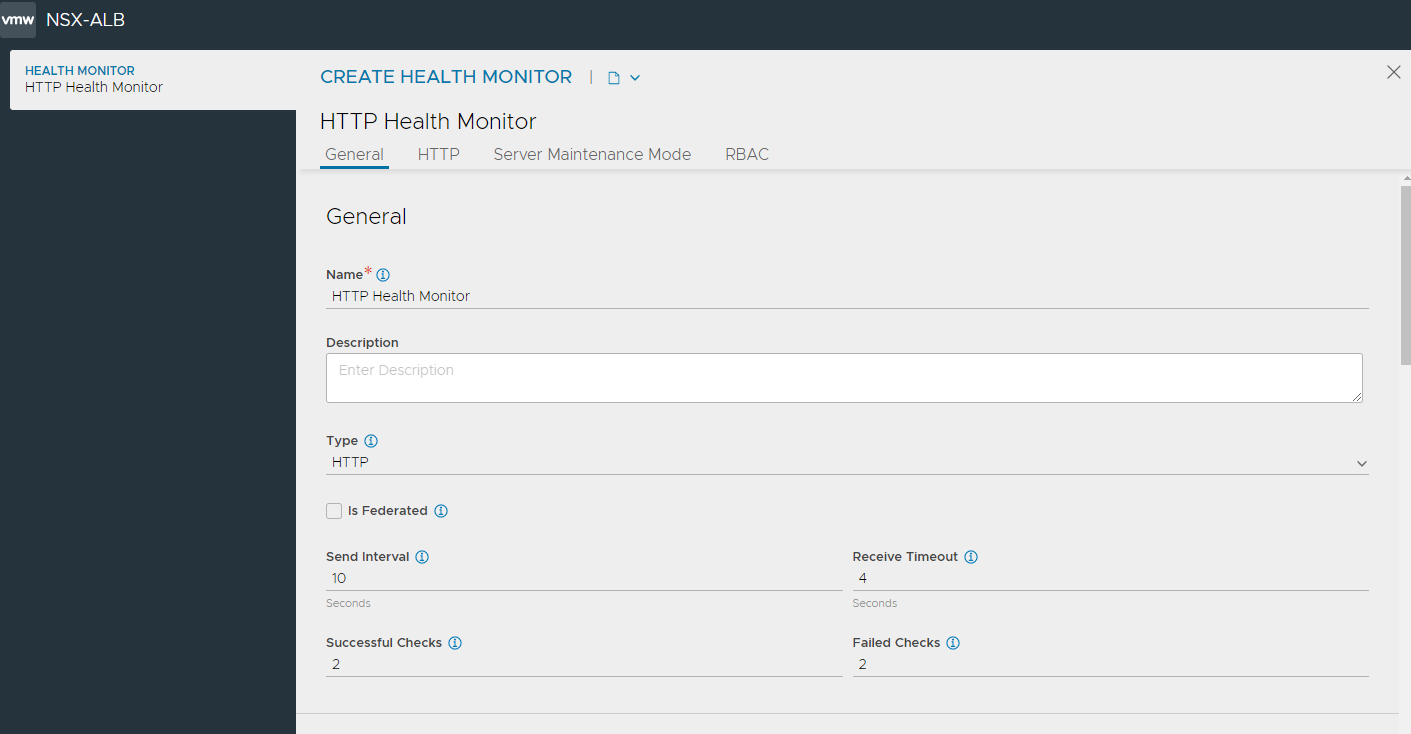
Configuring General Settings
Under the General tab of the CREATE HEALTH MONITOR screen, configure the following:
-
Enter a unique Name for the monitor.
-
Enter a Description.
-
Select HTTP as the Type of Health Monitor.
Note: Once the Type of Monitor is selected, options specific to the health monitor type are displayed. -
Select the option Is Federated? to replicate the object across the GSLB federation. When this option is not selected, the object is visible within the Controller-cluster and its associated SEs. This option is enabled only when GSLB is activated. A federated health monitor is used for GSLB purposes while it is not applicable for a regular (non-federated) health-monitor. A GSLB service cannot be associated with a regular (non-federated) health monitor, because GSLB service is a federated object, while the health monitor is not. Conversely, a pool cannot be associated with a federated health monitor because the pool is not a federated object.
-
Enter the Send Interval value (in seconds). This value determines how frequently the health monitor initiates an active check of a server. The frequency range is 1 to 3600.
-
Enter the Receive Timeout value (in seconds). The server must return a valid response to the health monitor within the specified time limit. The receive timeout range is 1 to 2400 or the send interval value minus 1 second.
Note: If the status of a server continually flips between up and down, this may indicate that the receive timeout is too aggressive for the server. -
Enter Successful Checks. This is the number of consecutive health checks that must succeed before NSX Advanced Load Balancer marks a down server as up. The minimum is 1, and the maximum is 50.
-
Enter Failed Checks. This is the number of consecutive health checks that on failing, NSX Advanced Load Balancer marks a server as down. The minimum is 1, and the maximum is 50.
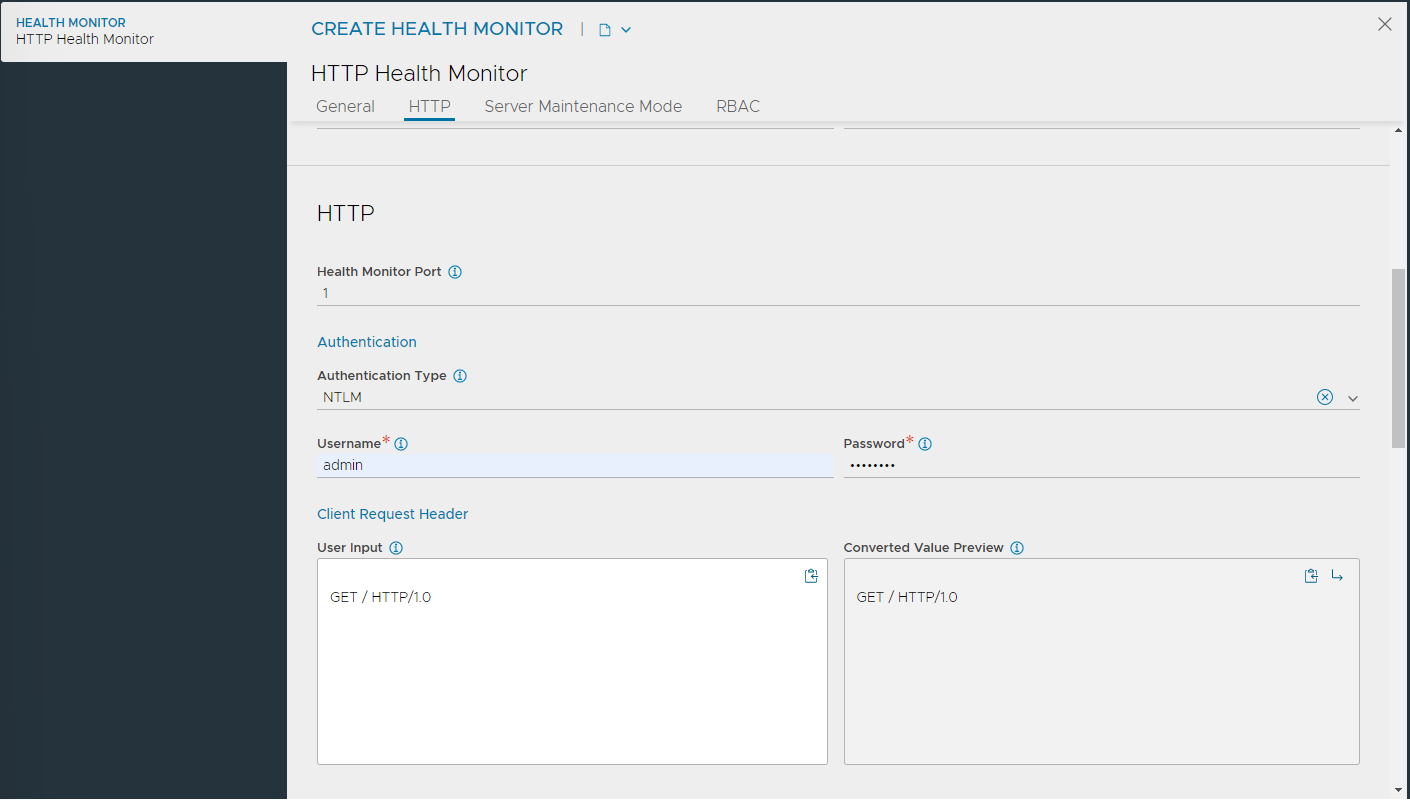
Configuring HTTP Settings
Under the HTTP tab, configure the following:
-
Specify a Health Monitor Port that should be used for the health check. When this field is configured, the clients are directed to a different port than the default port than the one that is monitored. When this field is left blank, the default port configured for the server is used.
-
Enter the Username and Password for server authentication. For further details on authenticating health monitors see Authenticating HTTP/HTTPS Health Monitor.
- Use the section Client Request Header, and Client Request Body to send an HTTP request to the web server. NSX Advanced Load Balancer does not validate the request, as different servers may support unique request syntax:
- Method: Any method may be used, though GET, POST and HEAD are the most common for monitoring. If no method is defined, NSX Advanced Load Balancer will use GET.
- GET /index.htm
- POST /upload.asp HTTP/1.0\r\nHost: www.site.com\r\nContent-Length: 10\r\nABCDE12345
- GET /index.htm
- Path: The path may include the URI and query, such as
/index.htm?user=test. If no path is specified,/will be used.
Note: Starting with NSX Advanced Load Balancer 22.1.3, the maximum size of the HTTP request body for health monitors is increased from 1024 bytes to 5120 bytes.
- Method: Any method may be used, though GET, POST and HEAD are the most common for monitoring. If no method is defined, NSX Advanced Load Balancer will use GET.
-
Select Use Exact Request to use the exact http_request string as specified by the user. This will avoid automatic insertion of headers like host header.
-
Under Server Response Data enter the match for a keyword in the first 2kb of the server header and body response.
-
In the Response Code field, enter HTTPS response codes for a successful match. A successful HTTP monitor requires either the response code, the server response data, or both fields to be populated. The response code expects the server to return a response code within the specified range. For a GET request, a server should usually return a 200, 301 or 302. For a HEAD request, the server will typically return a 304. A response code by itself does not validate the server’s response content, just the status.
Example Health Check
Sample HTTP health check send string:
GET /health/local HTTP/1.0
User-Agent: avi/1.0
Host: 10.10.10.3
Accept: */*
Sample server response:
HTTP/1.0 200 OK
Server: Apache-Coyote/1.1
Cache-Control: no-cache, no-store
Pragma: no-cache
Content-Type: text/plain
Content-Length: 15
Date: Fri, 20 May 2016 18:23:05 GMT
Connection: close

Health Check Ok
The server response includes both the Response Code: 200, and the Server Response Data: Health Check ok. Therefore this server will be marked up. Notice that Avi automatically includes additional headers in the send string, including User-Agent, Host, and Accept to ensure the server receives a fully formed request.
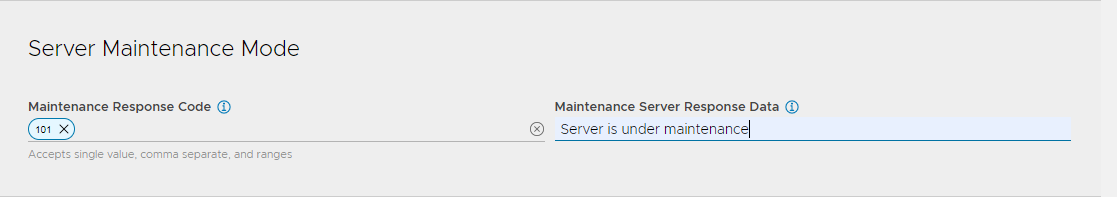
Configuring Server Maintenance Mode
Under the Server Maintenance Mode tab, configure the following:
- If the Maintenance Response Code is seen in the server response, it indicates that the server is placed in maintenance mode. A successful match marks the server down. Enter multiple response codes separated by commas.
- Enter Maintenance Server Response Data which when found in the server response, indicates that the server is placed in maintenance mode. A successful match marks the server down.
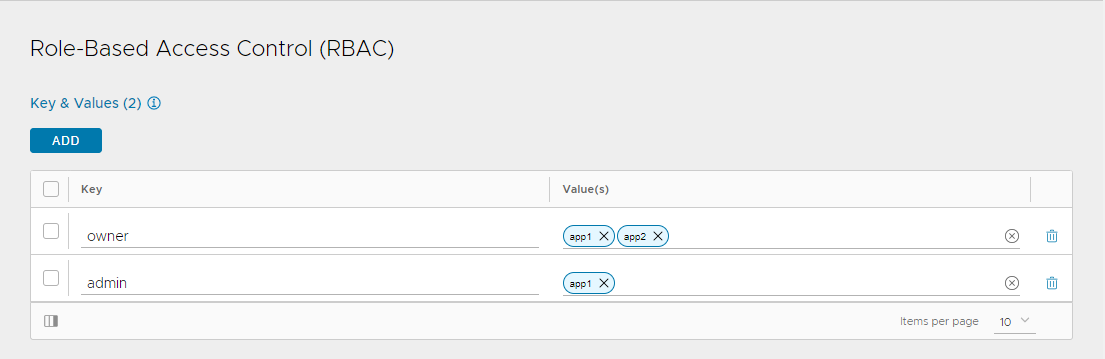
Configuring RBAC
- Under the Role-Based Access Control (RBAC) section, configure labels to control access to the health monitor based on the defined roles:
- Click Add.
- Enter the Key and the corresponding values.
See Granular RBAC for more information.
Configuring POST Method
You can configure POST method in the HTTP health monitor.
The following is the configuration example:
[admin:ctrl2]: > configure healthmonitor HTTP-HM-POST
[admin:ctrl2]: healthmonitor> type health_monitor_http
[admin:ctrl2]: healthmonitor> http_monitor
[admin:ctrl2]: healthmonitor:http_monitor> http_request "POST /echo_post_header_body HTTP/1.0"
[admin:ctrl2]: healthmonitor:http_monitor> http_request_body "This is a test for HTTP POST method"
[admin:ctrl2]: healthmonitor:http_monitor> http_response "test for HTTP"
[admin:ctrl2]: healthmonitor:http_monitor> http_response_code http_2xx
[admin:ctrl2]: healthmonitor:http_monitor> save
[admin:ctrl2]: healthmonitor> save
Note: When exact_request is configured, http_request_body will be appended to the end of http_request.
For further details on authenticating health monitors refer to Authenticating HTTP/HTTPS Health Monitor user guide.
Related Articles
- Read the Overview of Health Monitors article for general monitor information, implementation, and other monitor types.
- The Health Monitor Profile article introduces and explains the various settings available for all kinds of health monitors.