SE Memory Consumption
Overview
This guide discusses calculating the utilization of memory within a Service Engine (SE) to estimate the number of concurrent connections or the amount of memory that may be allocated to features such as HTTP caching.
Service Engines support 1-256 GB memory. Avi Vantage’s minimum recommendation is 2 GB. Providing more memory greatly increases the scale of capacity, as does adjusting the priorities for memory between concurrent connections and optimized performance buffers.
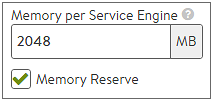
Memory allocation for Avi Vantage SE deployments in write access mode is configured via Infrastructure > Cloud > SE Group Properties. Changes to the Memory per Service Engine property only impact newly created SEs. For read or no access modes, the memory is configured on the remote orchestrator such as vCenter. Changes to existing SEs require the SE to be powered down prior to the change.
Memory Allocation
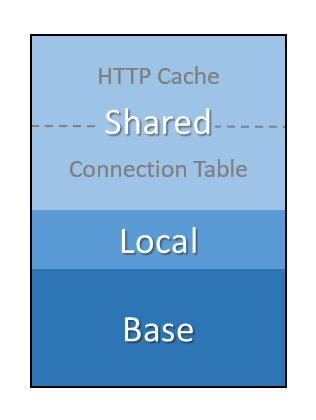
The following are the Service Engine’s memory allocation:
| Base |
500 MB | Required to turn on the SE (Linux plus basic SE functionality) |
| Local |
100 MB / core | Memory allocated per vCPU core |
| Shared |
Remaining | Remaining memory is split between Connections and Buffers |
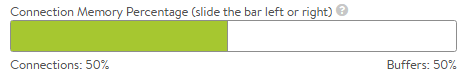
The shared memory pool is divided between two components, namely, Connections and Buffers. A minimum of 10% must be allocated to each. Changing the Connection Memory Percentage slider will impact newly created SEs but will not impact the existing SEs.
Connections consists of the TCP, HTTP, and SSL connection tables. Memory allocated to connections directly impacts the total concurrent connections that a Service Engine can maintain.
Buffers consists of application layer packet buffers. These buffers are used for Layer 4 through 7 to queue packets to provide improved network performance. For instance, if a client is connected to the Avi SE at 1Mbps with large latency and the server is connected to the SE at no latency and 10Gbps throughput, the server can respond to client queries by transmitting the entire response and move on to service the next client request. The SE will buffer the response and transmit it to the client at the much reduced speed, handling any retransmissions without needing to interrupt the server. This memory allocation also includes application centric features such as HTTP caching and improved compression.
Buffers maximize the number of concurrent connections by changing the priority towards connections. Avi Vantage’s calculations are based on the default setting, which is 50% of the shared memory available for connections.
Concurrent Connections
Most Application Delivery Controller (ADC) benchmark numbers are based on an equivalent TCP Fast Path, which uses a simple memory table of client IP:port mapped to server IP:port. This uses very little memory, enabling extremely large concurrent connection numbers. However, it is also not relevant to the vast majority of real world deployments which rely on TCP and application layer proxying. Avi Vantage’s benchmark numbers are based on full TCP proxy (L4), TCP plus HTTP proxy with buffering and basic caching plus DataScript (L7), and the same scenario with Transport Layer Security Protocol (TLS) 1.2 between client and Avi Vantage.
The memory consumption numbers per connection listed below can be higher or lower. For instance, typical buffered HTTP request headers consume 2k, but they can be as high as 48k. The numbers below are intended to provide real world sizing guidelines.
Memory consumption per connection:
- 10 KB L4
- 20 KB L7
- 40 KB L7 + SSL (RSA or ECC)
To calculate the potential concurrent connections for a Service Engine, use the following formula:
Concurrent L4 connections = ((SE memory - 500 MB - (100 MB * num of vCPU)) * Connection Percent) / Memory per Connection
To calculate layer 4 sessions (memory per connection = 10KB = 0.01MB) for an SE with 8 vCPU cores and 8 GB RAM, using a Connection Percentage of 50%, the math looks like: ((8000 - 500 - ( 100 * 8 )) * 0.50) / 0.01 = 335k.
| 1 vCPU | 4 vCPU | 32 vCPU | |
| 1 GB | 36k | n/a | n/a |
| 4 GB | 306k | 279k | n/a |
| 32 GB | 2.82m | 2.80m | 2.52m |
The calculations in the table are with 90% connection percentage. The table above shows the number of concurrent connections for L4 (TCP Proxy mode) optimized for connections.
View Allocation via CLI
From the CLI: show serviceengine <SE Name> memdist
This command shows a truncated breakdown of memory distribution for the SE. This SE has one vCPU core with 141 MB allocated for the shared memory’s connection table. The huge_pages value of 91 means there are 91 pages of 2 MB each. This indicates 182 MB has been allocated for the shared memory’s HTTP cache table.
[admin:grr-ctlr2]: > show serviceengine 10.110.111.10 memdist
+-------------------------+-----------------------------------------+
| Field                   | Value                                   |
+-------------------------+-----------------------------------------+
| se_uuid                 | 10-217-144-19:se-10.217.144.19-avitag-1 |
| proc_id                 | C0_L4                                   |
| huge_pages              | 2353                                    |
| clusters                | 1900544                                 |
| shm_memory_mb           | 398                                     |
| conn_memory_mb          | 4539                                    |
| conn_memory_mb_per_core | 1134                                    |
| num_queues              | 1                                       |
| num_rxd                 | 2048                                    |
| num_txd                 | 2048                                    |
| hypervisor_type         | 6                                       |
| shm_conn_memory_mb      | 238                                     |
| os_reserved_memory_mb   | 0                                       |
| shm_config_memory_mb    | 160                                     |
| config_memory_mb        | 400                                     |
| app_learning_memory_mb  | 30                                      |
| app_cache_mb            | 1228                                    |
+-------------------------+-----------------------------------------+
[admin:grr-ctlr2]: >
| Code | Description |
|---|---|
clusters |
The total number of packet buffers (mbufs) reserved for an SE. |
shm_memory_mb |
The total amount of shared memory reserved for an SE. |
conn_memory_mb |
The total amount of memory reserved from the heap for the connections. |
conn_memory_mb_per_core |
The amount of memory reserved from the heap for the connections per core (conn_memory_mb/ number of vCPUs). Here in this system, there are 4 vCPUs. |
shm_conn_memory_mb |
The amount of memory reserved from the shared memory reserved for the connections. |
num_queues |
The number of NIC queue pairs. |
num_rxd |
The number of RX descriptors. |
num_txd |
The number of TX descriptors. |
os_reserved_memory_mb |
The amount of extra memory reserved for non se datapth processes. |
shm_config_memory_mb |
The amount of memory reserved from the shared memory reserved for configuration. |
config_memory_mb |
The amount of memory reserved from the heap for configuration. |
hypervisor_type refers to the following list of hypervisor types and the respective values associated with it:
| Hypervisor Types | Values |
|---|---|
SE_HYPERVISOR_TYPE_UNKNOWN |
0 |
SE_HYPERVISOR_TYPE_VMWARE |
1 |
SE_HYPERVISOR_TYPE_KVM |
2 |
SE_HYPERVISOR_TYPE_DOCKER_BRIDGE |
3 |
SE_HYPERVISOR_TYPE_DOCKER_HOST |
4 |
SE_HYPERVISOR_TYPE_XEN |
5 |
SE_HYPERVISOR_TYPE_DOCKER_HOST_DPDK |
6 |
SE_HYPERVISOR_TYPE_MICROSOFT |
7 |
</code></pre>
View Allocation via API
The total memory allocated to the connection table and the percentage in use may be viewed. Use the following commands to query the API:
https://<IP Address>/api/analytics/metrics/serviceengine/se-<SE UUID>?metric_id=se_stats.max_connection_mem_total
Returns the total memory available to the connection table. In the response snippet below, 141 MB is allocated.
"statistics": {
   "max": 141,
}
https://<IP Address>/api/analytics/metrics/serviceengine/se-<SE UUID>?metric_id=se_stats.avg_connection_mem_usage&step=5
Returns the average percent of memory used during the queried time period. In the result snippet below, 5% of the memory was in use.
"statistics": {
   "min": 5,
   "max": 5,
   "mean": 5
},
Shared Memory Caching
Starting with Avi Vantage version 18.2.2, you can use the app_cache_percent field in the Service Engine properties to reserve a percentage of the Service Engine memory for Layer 7 caching. The default value is zero, which implies that Avi Vantage will not cache any object.
This is a property that takes effect on SE boot up and so needs a SE reboot/restart after the configuration.
If virtual service application profile caching is enabled, on upgrading Avi Vantage to 18.2.2 from an earlier version, this field is automatically set to 15. With this, 15% of Service Engine memory will be reserved for caching.
This value is a percentage configuration and not an absolute memory size. After configuring the feature, restart the Service Engine to enable the configuration.
Note:
Total memory allocated for caching must meet the 1GB min allocation per core. If app_cache_persent exceeds this condition then the allocated memory will be less than % of the Total System memory.
Example: App cache memory = Total memory - number of cores*1GB. For 10GB 9 Core SE, 15 % app_cache_percent would be 1GB instead of 1.5 GB.
Configuring using CLI
Enter the following commands to configure the app_cache_percent:
[admin:cntrlr]: > configure serviceenginegroup Serviceenginegroup-name
[admin:cntrlr]: serviceenginegroup> app_cache_percent 30

Overwriting the previously entered value for app_cache_percent
[admin:cntrlr]: serviceenginegroup> save
Configuring using UI
Starting with Avi Vantage version 18.2.5, you can enable this feature using Avi UI.
Navigate to Infrastructure > Service Engine Group, and click on the edit icon of the desired SE group. In the Basic Settings tab, under Memory Allocation section, enter the value meant to be reserved for Layer 7 caching in the Memory for Caching field.

Reduce the Core File Size
Starting with Avi Vantage version 18.2.8, the following new fields have been introduced which help exclude some sections from being included into the core:
core_shm_app_learning- To include shared memory for app learning in core file.core_shm_app_cache- To include shared memory for app cache in core file.
By default, these options are set to false.
Use the commands below and enable the options core_shm_app_learning and core_shm_app_cache.
[admin:cntrlr]: serviceenginegroup> core_shm_app_learning
Overwriting the previously entered value for core_shm_app_learning
[admin:cntrlr]: serviceenginegroup> core_shm_app_cache
Overwriting the previously entered value for core_shm_app_cache
[admin:cntrlr]: serviceenginegroup> save
Note: Restart/ reboot the SE for this configuration to take effect.
Per Virtual Service Level Admission Control
Connection Refusals to Incoming Requests on a Virtual Service
The connection refusals on a particular virtual service can be due to the high consumption of packet buffers by that virtual service. When the packet buffer usage of a virtual service is greater than 70% of the total packet buffers, the connection refusals start. This could mean that there is a slow client that is causing a packet buffer build up on the virtual service.
This can be alleviated by increasing the memory allocated per SE or by identifying and limiting the number of requests by slow clients using a network security policy.
Per virtual service level admission control is disabled by default. To enable this, set the Service Engine Group option per_vs_admission_control to True.
[admin Controller]: > configure serviceenginegroup <name-of-the-SE-group>
[admin Controller]: serviceenginegroup> per_vs_admission_control
Overwriting the previously entered value for per_vs_admission_control
[admin Controller]: serviceenginegroup> save
| per_vs_admission_control | True |
The connection refusals will stop when the packet buffer consumption on the Virtual Service drops to 50%.
The sample logs generated show admission control:
C255 12:46:28.774900 [se_global_calculate_per_vs_mbuf_usage:1561] Packet buffer usage for the Virtual Service: 'vs-http' UUID: 'virtualservice-e20cfff1-173f-4f4c-9028-4ae544116191' has breached the threshold 70.0%, current value is 71.8%. Starting admission control.
C255 12:49:01.285088 [se_global_calculate_per_vs_mbuf_usage:1575] Packet buffer usage for the Virtual Service: 'vs-http' UUID: 'virtualservice-e20cfff1-173f-4f4c-9028-4ae544116191' is below the threshold 50.0%, current value is 46.7%. Stopping admission control.
The connection refusals and packet throttles due to admission control can be monitored using the se_stats metrics API:
https://<Controller-IP>/api/analytics/metrics/serviceengine/se-<SE-UUID>?metric_id=se_stats.sum_connection_dropped_packet_buffer_stressed,se_stats.sum_packet_dropped_packet_buffer_stressed
To know how to resolve intermittent connection refusals are on Avi Service Engines correlating to higher traffic volume, click here.
| Date | Change Summary |
|---|---|
| December 22, 2020 | Updated the content for Per Virtual Service Level Admission Control |