Application Services

<< Back to Technical Glossary

Application Services Definition

Application Services (often used instead of application management services or application services management) are a pool of services such as load balancing, application performance monitoring, application acceleration, autoscaling, micro‑segmentation, service proxy and service discovery needed to optimally deploy, run and improve applications.

Diagram depicting application services such as; load balancing, performance monitoring, autoscaling, service proxy, SSL offload and WAF for applications running on servers and being delivered to application clients.
FAQs

What is Application Services Management?

The process of configuring, monitoring, optimizing and orchestrating different app services is known as application services management.

Today, organizations with their own data centers or which use the public cloud, handle applications services management. In the early days of online adoption, application service providers (or ASPs) were companies which would deliver applications to end users for a fixed cost. This single tenant, hosted model was largely replaced by the advent of the Software-as-a-Service (SaaS) delivery model which was multi-tenant and on-demand.

What is Cloud Application Services?

Cloud App Services are a wide range of specific application services for applications deployed in cloud-based resources. Services such as load balancing, application firewalling and service discovery can be achieved for applications running in private, public, hybrid or multi-cloud environments.

What are App Modernization Services?

Traditional applications were built as monolithic blocks of software. These monolithic applications have long life cycles because any changes or updates to one function, usually requires reconfiguring the entire application. This costly and time consuming process delays advancements and updates in application development.

Application Modernization Services enable the migration of monolithic, legacy application architectures to new application architectures that more closely match the business needs of modern enterprises’ application portfolio. Application modernization is often part of an organization’s digital transformation.

An example of this is the use of a microservices architecture where all app services are created individually and deployed separately from one another. This allows for scaling services based on specific business needs. Services can also be rapidly changed without affecting other parts of the application. Application-centric enterprises are choosing microservices architectures to take advantage of flexible container-based infrastructure models.

How does VMware NSX Advanced Load Balancer Enable Application Services?

The VMware NSX Advanced Load Balancer disrupts the industry’s definition of Application Delivery Controllers (ADCs) with a 100% software approach to application services. Unlike legacy, appliance-based ADCs, The VMware NSX Advanced Load Balancer delivers app services beyond load balancing, including, service proxy, application analytics, autoscaling, app map and micro-segmentation even for modern application architectures.

For more on the actual implementation of load balancing, security applications and web application firewalls check out our Application Delivery How-To Videos.

For more information on multi-cloud see the following resources:

Application Services Anywhere
Application Services 101

Application Health Score Definition

Application health score provides an at-a-glance view of the application’s health.

In the context of the VMware NSX Advanced Load Balancer the application health score is a computed representation of how well the application is working based on its performance, resource utilization, security and any anomalous behavior. The health score is expressed as a numerical score from 1 to 100.

How VMware NSX Advanced Load Balancer uses application health score to simplify operations? In the VMware NSX Advanced Load Balancer applications are color coded to indicate the health of an application. Green means that the health score of a particular application is between 90 – 100. Yellow means that the health score of a particular application is between 70 – 89 and there are issues that can be identified and fixed. Red means that the health score of a particular application is less that 70 and immediate attention is needed in order to fix issues that will improve the security posture and end user experience.

For more information see:
Virtual Service Health Monitoring

Application Acceleration

Application Acceleration Definition

Application acceleration improves application performance using techniques like compression, caching and transmission control protocol (TCP) optimization. It is a common feature in an application delivery controller (ADC) to improve response time over network connections.

Diagram depicts an application delivery controller prioviding application acceleration through compression, caching and TCP optimization to make web servers respond faster to application (end user) side requests over the internet.
FAQs

What is Application Acceleration?

Application acceleration is a network solution for issues like WAN latency, packet loss and bandwidth congestion. It uses optimization of protocols to improve application performance beyond caching.

For applications that promise extensive interactive content, application acceleration technology allows for quick rendering and page loads that meet user expectations.

Application Acceleration and WAN Optimization

Application acceleration and WAN optimization help scale networks when infrastructure no longer meets the needs of advanced application performance. This improves performance, productivity and application security while minimizing costs.

Enterprises should be aware that some solutions rely on “tunneling,” which routes optimized traffic directly to to a distant accelerator. Accelerators that use “tunnels” can overlook some routers.

Application Acceleration Benefits

Application acceleration software uses technology that creates a LAN-like performance over the WAN. Some of the benefits include:

  • Faster user experience for applications with interactive content.
  • Better ability to scale to meet peak demand.
  • Lower operational and investment cost.
  • Less security risk with SSL-protected content.


An application acceleration platform uses the following technologies:

  • Bandwidth optimization — Provides data redundancy elimination (DRE) and compression. All static information is stored locally to reduce need to access the data center for information.
  • Throughput optimization — Makes transport protocols more efficient in WAN environments.
  • Advanced protocol optimization — Uses read-ahead, message prediction and caching to mitigate latency.


Application Acceleration Appliance Versus Software

Recent application acceleration and WAN optimization technology has made it possible to forgo hardware-based appliances for more efficient, flexible and cost-effective software-based applications. They offer the following benefits:

  • Flexibility to run on industry standard servers.
  • Dynamic resource allocation and sharing.
  • Increased utilization
  • High availability
  • Scalability that surpasses hardware appliance capability
  • Central deployment and management
  • Lower total cost of ownership (TCO) of up 60 percent versus deploying hardware over a three year period.


Which Companies Provide Application Delivery Acceleration

Not all companies that offer application delivery controllers feature application acceleration equipment or functions such as caching, compression and TCP optimization. Companies like A10 Networks, Array Networks, Citrix, F5 Networks and The VMware NSX Advanced Load Balancer do. But cloud-only ADCs like AWS and Microsoft Azure Load Balancer do not.

Does VMware NSX Advanced Load Balancer offer Application Acceleration?

Yes. The VMware NSX Advanced Load Balancer delivers application services including distributed load balancing, web application firewall, global server load balancing (GSLB), network and application performance management across a multi-cloud environment. It helps ensure fast time-to-value, operational simplicity, and deployment flexibility in a highly secure manner.

For more on the actual implementation of load balancing, security applications and web application firewalls check out our Application Delivery How-To Videos.

For more information see the following application acceleration resources:

Application Insights

Application Insights leverage the application analytics to provide a holistic understanding of application usage and its performance. Application Insights are helpful for developers to understand the usability and performance of the app and provide rich end-user experience.

How does VMware NSX Advanced Load Balancer deliver Application Insights?

Built on software-defined principles, the VMware NSX Advanced Load Balancer distributed load balancers that collect real-time telemetry (parameters such as concurrent open connections, round-trip time (RTT, throughput, errors, response latency, SSL handshake latency, response types, etc.) and deliver them to the central Controller. The Controller analyzes these metrics in real time to provide visual, actionable insights to administrators into application performance, end user experience, and network health. Administrators can use these insights to enforce policies such as capacity scaling, application scaling, micro-segmentation, etc.

Application Analytics

<< Back to Technical Glossary

Application Analytics Definition

Application analytics is the process of capturing, analyzing and delivering meaningful insights from application usage and metrics within application delivery.

Diagram depicts application analytics being gathered from application telemetry to analyze application usage and other performance metrics within application delivery.
FAQs

What is Application Analytics?

Application analytics provides insights into the performance of an application by producing real-time analysis through visualization of data. The application insights analytics include IT operations, customer experience and business outcomes. This allows enterprises to quickly troubleshoot performance questions and root cause issues in order to make needed changes for efficiency in real time.

Benefits of Using Application Analytics

The benefits of application analytics include:

• Contextualized analytics — Capture and analyze data in any context.
• Codeless analytics — Capture application data without writing new code.
• Real-time insights — Analyze streaming data in the moment.
• Log analytics — Log files can be analyzed quickly.
• Big data capability — Handles big data center needs.

Insights from Application Analytics

An analytics application platform provides the following insights:

• Request and failure rates — Discover the most popular and well-performing pages. Learn user locations and active times of day.
• Response time — Measure response times and failure rates compared to request rates to determine potential resourcing issues.
• Dependency rates — Determine if external services are causing slow downs.
• Exceptions — See reports of server and browser exceptions and analyze aggregated statistics.
• Page views and load performance — As reported by user browsers.
• Counts — For users and sessions.
• Host diagnostics — Including Docker and Azure.
• Diagnostic trace logs — Allow correlation of trace events with request from an application.
• Custom metrics — Track specific business events and key metrics.

Difference Between Application Usage Analytics
and Application Performance Analytics

Application usage analytics measures usage patterns. It allows developers to fix bugs quickly and build software that better serves users. It can also act as a mobile application analytics tool that provides the following information:

• Number of users running the application any given time period.
• Number of users that have installed the latest version.
• Geographical distribution of the software.
• Which features are most and least used.

Application performance analytics helps enterprises identify the location and cause of performance problems in a network, server or application. It lets enterprises monitor performance across complex operational silos.

Does VMware NSX Advanced Load Balancer offer Application Analytics?

Yes. The VMware NSX Advanced Load Balancer’s application analytics tools can be a network engineer’s best ally. The VMware NSX Advanced Load Balancer is based on a software-defined architecture that separates the data plane of distributed software load balancers from the central control plane. The Controller collects millions of data points in application telemetry from the load balancers to provide analytics services. These include unprecedented insights about application performance, security status, end user experience, and predictive autoscaling of load balancers as well as the backend application servers. The VMware NSX Advanced Load Balancer provides an integrated application analytics dashboard with a detailed view of end-to-end timing, application health score, log analytics, DDoS attack metrics and SSL transaction data.

For more on the actual implementation of load balancing, security applications and web application firewalls check out our Application Delivery How-To Videos.

For more application analytics resources see the following:

Application Security

<< Back to Technical Glossary

Application Security Definition

Application Security refers to the steps businesses take to identify, repair, and protect applications against security vulnerabilities. This includes the work administrators and application security engineers do to better understand why applications expose vulnerabilities to exploitations in security and how to make them safer in the future.

Diagram depicts the layer structure of Avi's Application Security firewall.
FAQs

What is Application Security?

Administrators, application security engineers, and others are tasked with web application security work to keep sensitive data confidential. They also maintain the integrity of all data while keeping it appropriately accessible, and protect it from modification by even genuine users. These goals require application security testing professionals to identify several things:

  • their organization’s critical assets;
  • all authorized users and their levels of access; and
  • any potential application vulnerabilities, and weakness in the data or source code.

They can then develop any remediation measures that may be appropriate. Assessing security threats in real-time, repairing security flaws, conducting penetration testing, and improving software security might all be part of the work of an administrator tasked with application development and security.

What are Application Security Risks?

Web application security challenges vary, from large-scale network disruption to targeted database manipulation. Here are some examples of application security risks:

  • Cross site scripting (XSS) is a vulnerability that enables an attacker to inject client-side scripts into a webpage. This allows the attacker to access critical information directly from the user. For example, an attacker may identify such a vulnerability on an e-commerce website, and embed HTML tags in the comments. A comment can then lead users to files that can steal visitor session cookies on another site—giving them access to anything from credit card numbers on down.
  • Denial-of-service (DoS) and distributed denial-of-service (DDoS) attacks enable remote attackers to overwhelm a targeted server or the infrastructure that supports it with various kinds of traffic. This illegitimate traffic eventually denies service to real users, shutting the server down.
  • SQL injection (SQLi) is a technique attackers use to exploit vulnerabilities in databases. Specifically, these attacks can reveal things like user names and passwords, or allow attackers to manipulate or destroy data, or to modify or create user permissions.
  • Cross-site request forgery (CSRF) is a technique hackers use to impersonate authorized users after tricking them into making an authorization request. Obviously high-level users are frequent targets of this technique, since their accounts have more permissions, and once the account is compromised, the attacker can remove, modify, or destroy data.
  • Memory corruption occurs when bad actors use various attacks on an app, eventually modifying some part of its memory accidentally. The result is unexpected behavior or failure of the software.
  • Buffer overflow happens when attackers inject malicious code into the defined memory space of the system. Overflowing the capacity in the buffer zone causes nearby portions of the app’s memory to be overwritten with data, creating potential vulnerabilities.
  • Finally, like anything else containing sensitive data, an app is vulnerable to a data breach.

Web Application Security

Application security best practices protect your business and your customers. To understand the basics of application security and how it can preserve your reputation, keep these application security fundamentals in mind:

  • Application security testing tools such as web vulnerability scanners can help reveal potential application security vulnerabilities.
  • A web application firewall or WAF serves as a barrier between the server and the world, protecting the web application against harmful HTTP traffic. The WAF can help guard against some kinds of attacks, such as cross site scripting, cross site forgery, and SQL injection.
  • DDoS mitigation strategies use system and application security tools to properly route legitimate requests without any drops in service and shake volumetric attack traffic at the perimeter.
  • Protect your online app’s domain name system or DNS from man-in-the-middle attacks, DNS cache poisoning, and other DNS lifecycle problems with comprehensive application security.
  • Automated web application security scanners only identify vulnerabilities that are technical, such as cross-site scripting (XSS), SQL injection (SQLi), and remote code execution. Conduct a manual audit as well to ensure your web application is functioning, and to identify vulnerabilities in the user experience and logical interface.
  • Ensure your web server is also secure using the latest best practices, because attackers can approach your web application through your server. Do this by limiting remote access, eliminating unnecessary functionality, segregating data, installing security patches, and tailoring user permissions.

Web Application Security Breach

Web application security breaches can be very profitable for cyber criminals. These data breaches are often deployed stealthily and can go undetected for months, exposing customers’ personal records and causing last damage to businesses’ infrastructure and reputation. Monitoring web application security threats are critical to detecting signs of a web application security breach as soon as possible. Signs of a breach include: application malfunctioning and/or slow down; unexpected log messages, new jobs or users, and/or altered files; browser warnings; and customer complaints via help desk emails or social media.

Diagram depicts the layer structure of Avi's Application Security firewall.

Web applications are now the top target for attacks and breaches for large corporations. And getting hit with a web application security breach can cost millions.

In the event of a web application security breach, IT security teams should be equipped with a well-defined incident response plan. This includes:

  • Identification: It is crucial to ensure that all breaches and their sources have been correctly identified. This can be accomplished by confirming that attack validation checks are correlated to ensure there are no false positives, detection mechanisms understand all application aspects, logs and reports capture and highlight anomalies, and WAF security filter rules and software are updated frequently.
  • Containment: Mitigate the impact of the breach by first creating a backup of the entire store of data on the affected web server. Then check all other services running on the machine hosting the web server to determine if the exploited vulnerability is an isolated incident or not. If possible, physically disconnect the system from which the attack originates.
  • Eradication: Once the threat source has been identified, eliminate the root cause of the breach by updating compromised passwords, remove the network channel and OS backdoor that facilitated the attack, and run the affected system through antivirus and malware tools.
  • Recovery: Replacing the hacked/defaced page with a clean page with a temporary message and and restore affected data using the backup.
  • Lessons learned: Web application security is an extremely valuable investment that requires ongoing maintenance. Every tier of a workforce, from the top down, should be aware of cyber security and familiar with a well-defined disaster recovery plan.

Enormous web application security breaches have affected some of the biggest, high-profile corporations in the world, compromising the data of millions of customers. As more businesses incorporate cloud based computing and use web applications to store and process data, web application security has become of the most significant areas of data security.

Why Application Security is Important

All businesses must address application security risks that could compromise their sensitive data, because damage from breaches is extreme and sometimes permanent. Application security is among the biggest targets for data breaches, and the state of application and particularly mobile security is in flux as technology changes and businesses struggle to keep pace with it.

As more companies move their apps and sites online, information security generally will become even more complex, and critical. This means application security technologies will grow ever more crucial to the security of business, the apps that run companies, and their data security.

Network Security vs Application Security

It’s a common web application security myth that a network firewall can protect websites and web applications behind it. However, network and application security are not the same.

Network security uses perimeter defenses such as firewalls to keep out bad actors and grant access to safe users. For example, administrators can configure firewalls to permit only specific users or IP addresses to access particular services.

However, these perimeter network defenses are not enough to guard web applications against malicious attacks. This is because web applications and business sites must be accessed by everyone. Traffic coming to and from web applications therefore can’t be analyzed by network firewalls, so they can’t block malicious requests. If bad actors want to exploit a vulnerability such as a Cross-site Scripting or an SQL injection, network security won’t help.

Web application security tools like network security scanners can help identify certain problems that network security systems miss—specific web application security issues like SQL Injection problems. Application security testing tools can scan all components of your app to ensure they are fully patched. For example, such a tool might alert an administrator if an FTP server allows anonymous users to write to it.

Cloud Application Security vs Web Application Security

A cloud application and a web application may be very similar, but they are not identical. A cloud app is used to access online services, but not necessarily using a web browser.

Typically, a cloud app is custom-built for cloud use, and often optimized for mobile. Its data is stored online in the cloud, cached completely for offline use.

This may mean the cloud app has different permissions or user needs to accommodate—and different application security issues to manage. Mobile apps are mostly cloud apps.

Web applications rely more heavily on the web browser and whatever security measures are in place to protect it. Cloud applications are web apps; you can use them with web browsers. However, not all web apps are cloud apps.

What is Web Application Security Software?

Web application security software is an appliance or software package configurable by the user that is designed to ensure a secure web application. A web application firewall or WAF is one example of web application software.

Unfortunately, all web application firewalls—like all other application security software packages and application security tools—depend on the user. No mobile application security measures will function properly if they were not configured correctly.

What is the best way to go About Improving Web Application Security?

Web application security testing is a critical part of managing any app. Follow the best application security principles to improve your outlook, and get expert help creating a plan for your app.

How does VMware NSX Advanced Load Balancer help with Application Security?

VMware NSX Advanced Load Balancer’s Web Application Firewall (WAF) provides an application security solution in three critical steps: inspect, inform, and mitigate.
Inspect – The system analyzes user-to-application traffic and security configurations constantly. This allows it to identify vulnerabilities, and detect anomalies and attacks before it’s too late.

Inform – Next, VMware NSX Advanced Load Balancer’s WAF tells your key staff about the security status of your apps in real-time with logs, alerts, and simple metrics that reflect risks.

Mitigate – Finally, the WAF system allows you to proactively work against security problems, from simple to serious. Implement whatever action is necessary, from simple penalties to limits on traffic or blocks to specific users.

For more on the actual implementation of load balancing, security applications and web application firewalls check out our Application Delivery How-To Videos.

For more information about application security see:

Application Delivery Network

<< Back to Technical Glossary

Application Delivery Network Definition

An Application Delivery Network (ADN) is a group of services deployed simultaneously over a network to provide application availability, security, visibility and acceleration from application servers to application end users. Application delivery networking is comprised of WAN optimization controllers (WOCs) and application delivery controllers (ADCs).

Diagram depicts an application delivery network (ADN) showing a pool of application servers serving content over the web to clients complete with security, load balancing, app insights and more.
FAQs

What is an Application Delivery Network?

An application delivery network (ADN) ensures the speediness, security and availability of applications. The ADN delivers a suite of technologies over a network designed to maximize application performance. Load balancing is often included. An ADN is sometimes referred to as a content delivery network (CDN).

The terms are often used interchangeably, but there is a difference. CDNs focus on static content while ADNs optimize the acceleration of dynamic content.

What Is the Purpose of an Application Delivery Network?

An application delivery network platform helps data centers speed up load times and the application delivery process. They also help IT teams solve problems faster and provide a better user experience.

Application delivery networks bundle and deploy the technologies that improve network latency and security. They help streamline operations and optimize load balancing.

How Does Application Delivery Networking Work?

Application delivery networking uses real-time data to prioritize applications and access. Application delivery networks (ADN) operate with two components: a combination of a WAN optimization controller (WOC) and an application delivery controller (ADC).

The ADC is positioned at the data center end of the application delivery network. The ADC includes a load balancer that distributes web traffic over many servers. ADCs also handle caching, compression and offloading of Security Socket Layer (SSL) encryption.

The ADC component of an application delivery network was created when traditional load balancers could no longer handle a growing and diverse amount of web traffic.

The WOC is positioned in both the data center and near the end point. It improves application performance by focusing on latency optimization. The WOC also handles caching, compression, de-duplication and protocol spoofing.

ADCs and WOCs work together within the application delivery network to give applications more speed, availability and scalability.

What is the Difference between Application Delivery Networking vs. Content Delivery Networking (CDN)?

CDNs work by caching regularly used digital content at geographically distributed edge locations. When a client (end user) internet browser requests the cached content, it comes from the nearest edge location. By utilizing these edge locations in a strategic geographical pattern, static websites will see significant performance improvements. But for remote applications accessed over the public internet, this practice of caching content at edge locations fails to yield the same performance improvements.

By comparison, ADN is a combination of features that provide application availability, security, visibility, and acceleration. It is more comprehensive in the benefits to the end user than simply having a CDN cache website content.

What Are the Benefits of an Application Delivery Network?

Application delivery networking offers the benefits of security, visibility and acceleration:
• Moves data through the network at increased speed by using compression technologies.
• Improved network security with IP filtering, delayed binding, application firewalls and SSL encryption.
• More efficient traffic management with load balancers that also provide health checks and can automatically reroute traffic when needed.

Does VMware NSX Advanced Load Balancer Offer an Application Delivery Network?

Yes. The VMware NSX Advanced Load Balancer is used as an Application Delivery Network to deliver multi-cloud application services such as load balancing, application security, autoscaling, container networking and web application firewall. The VMware NSX Advanced Load Balancer automates application delivery, ensures applications are available, secure, and responsive to demand. Learn more about the VMware NSX Advanced Load Balancer application delivery architecture here.

For more on the actual implementation of load balancing, security applications and web application firewalls check out our Application Delivery How-To Videos.

For more information see the following application delivery networking resources:

Application Performance Monitoring (APM)

<< Back to Technical Glossary

Application Performance Monitoring Definition

Application performance monitoring (APM) is the management and monitoring of availability and performance of software applications in the systems management and information technology (IT) fields. The goal of APM is to maintain an expected level of service by identifying and diagnosing complex application performance problems. Traditionally, APM looks at the performance of the application itself, typically by examining log files, using agents or even AI algorithms to detect whether the application is behaving as expected. Recently, organizations are looking at the network-level behavior of the application – the requests it makes on other infrastructure resources, the bandwidth required, traffic loads. This is done by load balancers and application delivery controllers that can ensure each application is responding within normal parameters.

This image depicts an application performance monitoring system and process of an APM software transferring data to the cloud.

APM is carried out using a variety of application performance monitoring tools. APM tools provide administrators with critical information, enabling them to quickly detect and resolve problems that affect application performance.

Gartner first originated an application performance monitoring framework to focus monitoring efforts. That first iteration had five focus areas:

End-user experience monitoring. Also called digital user experience monitoring, end-user experience monitoring tracks the behavior of a software application from the user’s point of view, searching for experiences of downtime, slowness, or errors. A proactive approach to end-user experience is possible with synthetic monitoring, and real-user monitoring offers a passive approach.

Application runtime architecture discovery, modeling, and display. This area involves visualizing and mapping all components of application architecture to see how they interact and detect problems more readily.

User-defined transaction profiling. This method analyzes each user transaction, and detects and isolates application performance issues and the specific interactions they are connected to. Tracing enables developers to find the precise database query, line of code, or third-party call along the user’s journey from frontend to backend that affects application performance.

Application deep-dive analysis. This section refers to the integrated monitoring of all application infrastructure components and collection of their performance metrics.

IT operations analytics. This refers to the preventative aspect of analyzing data to detect trends, patterns in usage, and performance problems to improve a strategy, enhance end-user experience, and prevent similar issues moving forward.

In 2016, Gartner reorganized this framework to include three parts:

  • Digital experience monitoring (DEM) now replaces end-user experience monitoring
  • Application discovery, tracing and diagnostics (ADTD) now covers the middle three sections touching on application deep-dive analysis, transaction profiling, and application topology
  • Artificial intelligence for IT operations (AIOps) for applications now replaces IT operations analytics

Application Performance Monitoring FAQs

What is Application Performance Monitoring?

Businesses can use application performance monitoring solutions to do a number of things:

  • Analyze their IT environment to determine whether it meets performance standards.
  • Identify, repair, and prevent potential issues and bugs in the IT environment.
  • Closely monitor IT resources to offer flawless user experiences.
  • Prevent anomalous application behaviors that impact network performance.


The best application performance monitoring services and solutions reduce mean time to resolution (MTTR) by empowering IT teams with essential information that links business outcomes and application performance, and detects and fixes performance issues and network anomalies before they affect user experience.

Although the related terms “application performance monitoring” and “application performance management” are sometimes both abbreviated APM and used interchangeably, application performance management and monitoring are not the same thing. Application performance management typically refers to a broader management strategy for better application performance that includes application performance monitoring.

End-to-end application performance monitoring provides actual data insights on a number of set metrics (see the section below for application performance monitoring best practices and metrics). Application performance monitoring focuses solely on tracking application performance, while application performance management has a wider focus on controlling the performance levels of the application—and monitoring is one component of this management.

How to Monitor Application Performance?

Most APM solutions boast a range of application performance monitoring features focused on infrastructure monitoring and tracking application dependencies, the user experience, and business transactions. To prevent negative impact to application performance, APM tools give administrators essential data for detecting and solving problems quickly.

Types of Application Performance Monitoring Tools

There are several basic types of application performance management tools:

Metrics-based application performance monitoring tools. These APM tools use various app and server metrics which may identify slow areas, but are unlikely to reveal insights into causes of slow performance.
Code-level application performance monitoring tools. A better solution for application performance monitoring is based in code-level diagnostics, transaction tracing, and profiling because it provides more insight into causes of poor application performance.
Network-based application performance monitoring tools. This class of APM tools, sometimes called network-based performance monitoring, network-based performance management (NPM), or an application performance monitoring cloud service, closely monitors all network traffic and offers actionable insights into it to measure application performance. This is often handled by a load balancer.

What Do APM Tools Monitor?

Real-time insight into the health of each business transaction the application processes is critical to supporting the user journey. For this reason, APM tools engage in end-to-end application performance monitoring by enforcing several application performance monitoring requirements:

  • Observing application behavior for anything abnormal
  • Detecting abnormal application behavior, gathering data on the source of the issue—the application itself, or other issues such as supporting infrastructure or app dependencies—and alerting the administrators about the problem
  • Analyzing the collected data for business impact
  • Adapting to prevent the same issue from recurring by fixing similar flaws in the application environment—before business impact


Ideally, application performance monitoring companies monitor and collect data on everything that affects app availability. Among the most critical application performance monitoring metrics are:

Application availability/uptime. This common metric refers to whether the application is available and online. Uptime and availability are frequently cited in service level agreements (SLAs).
CPU usage. At the server level, APM tracks CPU usage, disk read/write speeds, and memory demands at the server level.
Customer satisfaction. How users perceive their experience is among the most important metrics.
Error rates. Application performance monitoring tracks when application performance fails or degrades (such as when a search or other web request ends in an error), and how often that happens, at the software level.
Garbage collection (GC). Many applications use programming languages such as Java that use GC, well-known for its heavy memory use and impact on performance.
Number of instances. How many app or server instances of elastic, cloud-based applications are running at any one time affect performance. High user demand may require an application performance monitoring strategy that supports autoscaling.
Request rates. The request rate metric reflects how much traffic, including numbers of concurrent users, spikes, and inactivity, the application receives.
Response times. Average response time simply reflects whether performance is being hindered by application speed.

Application performance monitoring APM tools differ in their features, but each tool must:

  • Monitor and track the response time and performance of web applications or software
  • Collect performance metrics to create a performance baseline and alert administrators if variation in that baseline occurs
  • Generate visual data to deepen insights into performance metrics for users
  • Help to identify and fix application performance problems and changes in network behavior

Why Do We Need Application Performance Monitoring?

The best application performance monitoring systems create a single source of truth by correlating monitoring data in an APM application performance monitoring dashboard, preventing data silos. This saves the manual time of the IT team, eliminating the need to build synthetic monitors or search through individual event logs. Application performance monitoring architecture also enables a more proactive approach to customer feedback and empowers that approach with evidence.

How Does VMware NSX Advanced Load Balancer Help With Application Performance Monitoring?

The VMware NSX Advanced Load Balancer is an analytics driven L4-L7 load balancing solution that complements some of the best application performance monitoring tools, such as New Relic, AppDynamics and Dynatrace. The VMware NSX Advanced Load Balancer provides a view of the application health in the context of the network, security and end-user experience by looking at the network behavior of each application or microservice. This enables The VMware NSX Advanced Load Balancer to be analytics-driven when it comes to autoscaling load balancers as well as back-end applications.

One way to consider the difference between a traditional APM solution and The VMware NSX Advanced Load Balancer and how they work together is through the level of granularity. An APM solution is like a microscope looking at the performance of the application at the code-level – are the application’s CPU usage, storage requirements, response times within accepted norms. The VMware NSX Advanced Load Balancer looks at the application from the microscope level – with broader context within the environment. Namely, is the application using acceptable bandwidth, connecting with expected services, using the correct server resources? These indicate whether the application has been corrupted or is malfunctioning at a higher level, one which could impact other application or network services.

For more information on The VMware NSX Advanced Load Balancer’s elastic application performance monitoring system see:


For more on the actual implementation of load balancers, check out our Application Delivery How-To Videos.

Application Delivery Controller

<< Back to Technical Glossary

Application Delivery Controller Definition

Application Delivery Controllers (ADCs) provide load balancing, application acceleration, SSL termination, and app security along with seamless access to applications. ADCs, also called app delivery controllers, may be delivered in three form factors: hardware appliances, virtual appliances (the software extracted from legacy hardware) and software-only load balancers.

Diagram depicting an application delivery controller for application services on bare metal, virtualized, microservices containers or multi-cloud application architectures.
FAQs

What Is an Application Delivery Controller?

Application Delivery Controllers (ADCs) provide security and access to applications at peak times. As computing moves to the cloud, software ADCs perform tasks that have been traditionally performed by custom-built hardware. They also come with added functionality and flexibility for application deployment. They let an organization quickly and securely scale up its application services based on demand in the cloud. Modern software ADCs allow organizations to consolidate network-based services. Critical capabilities for application delivery controllers include SSL/TLS offload, caching, compression, intrusion detection, web application firewalls, and microservices for container applications. This creates even faster delivery times and greater scalability.

What Is an Application Delivery Controller Used For?

Traditional application delivery controllers (ADCs) were used for load balancing application servers to manage traffic and application deployment. Next-generation ADCs have new functions that include SSL offloading, visibility, application analytics, multi-cloud support, TCP optimizations, rate shaping and web application firewalls.

How Do Application Delivery Controllers Work?

An application delivery controller (ADC) is primarily a load balancer that manages traffic flow to servers. ADCs help optimize end-user performance and application deployment. ADCs also assist in application acceleration and provide security for applications.

An ADC uses techniques like application classification, compression and reverse caching to improve acceleration of business applications. ADCs determine security needs as the single point of control for multiple servers.

ADCs handle distributed denial-of-service (DDoS) attacks and secure web applications against common threats using web application firewalls (WAFs). ADCs can also provide SSL offloading and application autoscaling.

The following techniques are most commonly used by ADCs to enhance application performance:

• Load balancing: Distributes incoming requests across a group of servers. Algorithms consider server capacity, type of content requested and client location to improve performance.

• Caching: Stores content locally on the ADC, which speeds delivery and reduces server load.

• Compression: Large files such as images, music and video are compressed to speed delivery and increase network capacity.

• Offloading SSL processing: The ADC replaces backend servers as the SSL endpoint for client connections. By doing the decryption and encryption work for servers, the ADC speeds content delivery by freeing up servers for other tasks.

Who uses an App Delivery Controller?

App Delivery Controllers are used by almost any company or enterprises that utilize large scale content delivery networks (CDNs) to provide fast web application (software) services and ensure high traffic websites are secure, always on, and available to their users. They are commonly used as a reverse proxy server, placed inbetween web servers and the internet by removing load from their origin servers and ensure high availability for a seamless end user experience. As more companies embrace the digital transformation to update their web and networks architectures, DevOps engineers are increasingly responsible for managing application delivery controllers, analyzing their performance, and optimizing for application acceleration because they are more often that not building the applications that rely on the load balancers (controllers). In many organizations however, network teams and IT teams still manage application delivery especially in cases where the controllers are legacy or hardware based.

Where Is an Application Delivery Controller Deployed?

An application Delivery Controller (ADC) is positioned between enterprise web servers and end-customers to manage application traffic. For additional security, ADCs often deploy a web application firewall in addition to the load balancer.

When Is an Application Delivery Controller Required?

Application delivery controllers (ADCs) are essential for industries such as retail, financial services, ecommerce, and healthcare that have hundreds of web servers to handle thousands of simultaneous customer requests. Load-balancing provided by ADCs ensures applications run smoothly despite spikes in traffic.

Does VMware NSX Advanced Load Balancer Offer an Application Delivery Controller?

Yes. The VMware NSX Advanced Load Balancer offers an intent-based and software-defined solution that is disrupting the ADC (load balancer) market and changing the way that businesses consume application services through automation and analytics. The VMware NSX Advanced Load Balancer is a multi-cloud and enterprise-grade solution that accelerates cloud transformation for enterprises with on premises (traditional / monolithic) and public cloud (containerized) applications. Learn more about The VMware NSX Advanced Load Balancer application delivery architecture.

For more on the actual implementation of load balancing, security applications and web application firewalls check out our Application Delivery How-To Videos.

For more information on application delivery controllers see the following resources:

Anomaly Detection

< << Back to Technical Glossary

Anomaly Detection

Anomaly detection, also called outlier detection, is the identification of unexpected events, observations, or items that differ significantly from the norm. Often applied to unlabeled data by data scientists in a process called unsupervised anomaly detection, any type of anomaly detection rests upon two basic assumptions:

  • Anomalies in data occur only very rarely
  • The features of data anomalies are significantly different from those of normal instances

Typically, anomalous data is linked to some sort of problem or rare event such as hacking, bank fraud, malfunctioning equipment, structural defects / infrastructure failures, or textual errors. For this reason, identifying actual anomalies rather than false positives or data noise is essential from a business perspective.

Diagram depicts end-to-end timing anomaly detection to identify unexpected events.
Anomaly Detection FAQs

What is Anomaly Detection?

Anomaly detection is the identification of rare events, items, or observations which are suspicious because they differ significantly from standard behaviors or patterns. Anomalies in data are also called standard deviations, outliers, noise, novelties, and exceptions.

In the network anomaly detection/network intrusion and abuse detection context, interesting events are often not rare—just unusual. For example, unexpected jumps in activity are typically notable, although such a spurt in activity may fall outside many traditional statistical anomaly detection techniques.

Many outlier detection methods, especially unsupervised techniques, do not detect this kind of sudden jump in activity as an outlier or rare object. However, these types of micro clusters can often be identified more readily by a cluster analysis algorithm.

There are three main classes of anomaly detection techniques: unsupervised, semi-supervised, and supervised. Essentially, the correct anomaly detection method depends on the available labels in the dataset.

Supervised anomaly detection techniques demand a data set with a complete set of “normal” and “abnormal” labels for a classification algorithm to work with. This kind of technique also involves training the classifier. This is similar to traditional pattern recognition, except that with outlier detection there is a naturally strong imbalance between the classes. Not all statistical classification algorithms are well-suited for the inherently unbalanced nature of anomaly detection.

Semi-supervised anomaly detection techniques use a normal, labeled training data set to construct a model representing normal behavior. They then use that model to detect anomalies by testing how likely the model is to generate any one instance encountered.

Unsupervised methods of anomaly detection detect anomalies in an unlabeled test set of data based solely on the intrinsic properties of that data. The working assumption is that, as in most cases, the large majority of the instances in the data set will be normal. The anomaly detection algorithm will then detect instances that appear to fit with the rest of the data set least congruently.

What Are Anomalies?

Anomalies can classified generally in several ways:

Network anomalies: Anomalies in network behavior deviate from what is normal, standard, or expected. To detect network anomalies, network owners must have a concept of expected or normal behavior. Detection of anomalies in network behavior demands the continuous monitoring of a network for unexpected trends or events.

Application performance anomalies: These are simply anomalies detected by end-to-end application performance monitoring. These systems observe application function, collecting data on all problems, including supporting infrastructure and app dependencies. When anomalies are detected, rate limiting is triggered and admins are notified about the source of the issue with the problematic data.

Web application security anomalies: These include any other anomalous or suspicious web application behavior that might impact security such as CSS attacks or DDOS attacks.

Detection of each type of anomaly relies on ongoing, automated monitoring to create a picture of normal network or application behavior. This type of monitoring might focus on point anomalies/global outliers, contextual anomalies, and/or collective anomalies; the context of the network, the performance of the application, or the web application security is more important to the goal of the anomaly detection system.

Anomaly detection and novelty detection or noise removal are similar, but distinct. Novelty detection identifies patterns in data that were previously unobserved so users can determine whether they are anomalous. Noise removal is the process of removing noise or unneeded observations from a signal that is otherwise meaningful.

To track monitoring KPIs such as bounce rate and churn rate, time series data anomaly detection systems must first develop a baseline for normal behavior. This enables the system to track seasonality and cyclical behavior patterns within key datasets.

Why Anomaly Detection Is Important

It is critical for network admins to be able to identify and react to changing operational conditions. Any nuances in the operational conditions of data centers or cloud applications can signal unacceptable levels of business risk. On the other hand, some divergences may point to positive growth.

Therefore, anomaly detection is central to extracting essential business insights and maintaining core operations. Consider these patterns—all of which demand the ability to discern between normal and abnormal behavior precisely and correctly:

  • An online retail business must predict which discounts, events, or new products may trigger boosts in sales which will increase demand on their web servers.
  • An IT security team must prevent hacking and needs to detect abnormal login patterns and user behaviors.
  • A cloud provider has to allot traffic and services and has to assess changes to infrastructure in light of existing patterns in traffic and past resource failures.

A evidence-based, well-constructed behavioral model can not only represent data behavior, but also help users identify outliers and engage in meaningful predictive analysis. Static alerts and thresholds are not enough, because of the overwhelming scale of the operational parameters, and because it’s too easy to miss anomalies in false positives or negatives.
To address these kinds of operational constraints, newer systems use smart algorithms for identifying outliers in seasonal time series data and accurately forecasting periodic data patterns.

Anomaly Detection Techniques

In searching data for anomalies that are relatively rare, it is inevitable that the user will encounter relatively high levels of noise that could be similar to abnormal behavior. This is because the line between abnormal and normal behavior is typically imprecise, and may change often as malicious attackers adapt their strategies.

Furthermore, because many data patterns are based on time and seasonality, there is additional baked-in complexity to anomaly detection techniques. The need to break down multiple trends over time, for example, demands more sophisticated methods to identify actual changes in seasonality versus noise or anomalous data.

For all of these reasons, there are various anomaly detection techniques. Depending on the circumstances, one might be better than others for a particular user or data set. A generative approach creates a model based solely on examples of normal data from training and then evaluates each test case to see how well it fits the model. In contrast, a discriminative approach attempts to distinguish between normal and abnormal data classes. Both kinds of data are used to train systems in discriminative approaches.

Clustering-Based Anomaly Detection

Clustering-based anomaly detection remains popular in unsupervised learning. It rests upon the assumption that similar data points tend to cluster together in groups, as determined by their proximity to local centroids.

K-means, a commonly-used clustering algorithm, creates ‘k’ similar clusters of data points. Users can then set systems to mark data instances that fall outside of these groups as data anomalies. As an unsupervised technique, clustering does not require any data labeling.

Clustering algorithms might be deployed to capture an anomalous class of data. The algorithm has already created many data clusters on the training set in order to calculate the threshold for an anomalous event. It can then use this rule to create new clusters, presumably capturing new anomalous data.

However, clustering does not always work for time series data. This is because the data depicts evolution over time, yet the technique produces a fixed set of clusters.

Density-Based Anomaly Detection

Density-based anomaly detection techniques demand labeled data. These anomaly detection methods rest upon the assumption that normal data points tend to occur in a dense neighborhood, while anomalies pop up far away and sparsely.

There are two types of algorithms for this type of data anomaly evaluation:

K-nearest neighbor (k-NN) is a basic, non-parametric, supervised machine learning technique that can be used to either regress or classify data based on distance metrics such as Euclidean, Hamming, Manhattan, or Minkowski distance.

Local outlier factor (LOF), also called the relative density of data, is based on reachability distance.

Support Vector Machine-Based Anomaly Detection

A support vector machine (SVM) is typically used in supervised settings, but SVM extensions can also be used to identify anomalies for some unlabeled data. A SVM is a neural network that is well-suited for classifying linearly separable binary patterns—obviously the better the separation is, the clearer the results.

Such anomaly detection algorithms may learn a softer boundary depending on the goals to cluster the data instances and identify the abnormalities properly. Depending on the situation, an anomaly detector like this might output numeric scalar values for various uses.

Anomaly Detection Machine Learning

As mentioned briefly above, supervised, semi-supervised, or unsupervised machine learning techniques provide the foundation for anomaly detection algorithms.

Supervised Machine Learning for Anomaly Detection

Supervised machine learning builds a predictive model using a labeled training set with normal and anomalous samples. The most common supervised methods include Bayesian networks, k-nearest neighbors, decision trees, supervised neural networks, and SVMs.

The advantage of supervised models is that they may offer a higher rate of detection than unsupervised techniques. This is because they can return a confidence score with model output, incorporate both data and prior knowledge, and encode interdependencies between variables.

Unsupervised Machine Learning for Anomaly Detection

Unsupervised methods do not demand manual labeling of training data. Instead, they operate based on the presumption that only a small, statistically different percentage of network traffic is malicious and abnormal. These techniques thus assume collections of frequent, similar instances are normal and flag infrequent data groups as malicious.

The most popular unsupervised anomaly detection algorithms include Autoencoders, K-means, GMMs, hypothesis tests-based analysis, and PCAs.

Semi-Supervised Anomaly Detection

The term semi-supervised anomaly detection may have different meanings. Semi-supervised anomaly detection may refer to an approach to creating a model for normal data based on a data set that contains both normal and anomalous data, but is unlabelled. This train-as-you-go method might be called semi-supervised.

A semi-supervised anomaly detection algorithm might also work with a data set that is partially flagged. It will then build a classification algorithm on just that flagged subset of data, and use that model to predict the status of the remaining data.

Anomaly Detection Use Cases

Some of the primary anomaly detection use cases include anomaly based intrusion detection, fraud detection, data loss prevention (DLP), anomaly based malware detection, medical anomaly detection, anomaly detection on social platforms, log anomaly detection, internet of things (IoT) big data system anomaly detection, industrial/monitoring anomalies, and anomalies in video surveillance.

An anomaly based intrusion detection system (IDS) is any system designed to identify and prevent malicious activity in a computer network. A single computer may have its own IDS, called a Host Intrusion Detection System (HIDS), and such a system can also be scaled up to cover large networks. At that scale it is called Network Intrusion Detection (NIDS).

This is also sometimes called network behavior anomaly detection, and this is the kind of ongoing monitoring network behavior anomaly detection tools are designed to provide. Most IDS depend on signature-based or anomaly-based detection methods, but since signature-based IDS are ill-equipped to detect unique attacks, anomaly-based detection techniques remain more popular.

Fraud in banking (credit card transactions, tax return claims, etc.), insurance claims (automobile, health, etc.), telecommunications, and other areas is a significant issue for both private business and governments. Fraud detection demands adaptation, detection, and prevention, all with data in real-time.

Data loss prevention (DLP) is similar to prevention of fraud, but focuses exclusively on loss of sensitive information at an early stage. In practice, this means logging and analyzing accesses to file servers, databases, and other sources of information in near-real-time to detect uncommon access patterns.

Malware detection is another important area, typically divided into feature extraction and clustering/classification stages. Sheer scale of data is a tremendous challenge here, along with the adaptive nature of the malicious behavior.

Detecting anomalies in medical images and records enables experts to diagnose and treat patients more effectively. Massive amounts of imbalanced data means reduced ability to detect and interpret patterns without these techniques. This is an area that is ideal for artificial intelligence given the tremendous amount of data processing involved.

Detecting anomalies in a social network enables administrators to identify fake users, online fraudsters, predators, rumor-mongers, and spammers that can have serious business and social impact.

Log anomaly detection enables businesses to determine why systems fail by reconstructing faults from patterns and past experiences.

Monitoring data generated in the field of the Internet of things (IoT) ensures that data generated by IT infrastructure components, radio-frequency identification (RFID) tags, weather stations, and other sensors are accurate and identifies faulty and fraudulent behavior before disaster strikes. The same is true of monitoring industrial systems such as high-temperature energy systems, power plants, wind turbines, and storage devices that are exposed to massive daily stress.

How Does VMware NSX Advanced Load Balancer Help With Anomaly Detection?

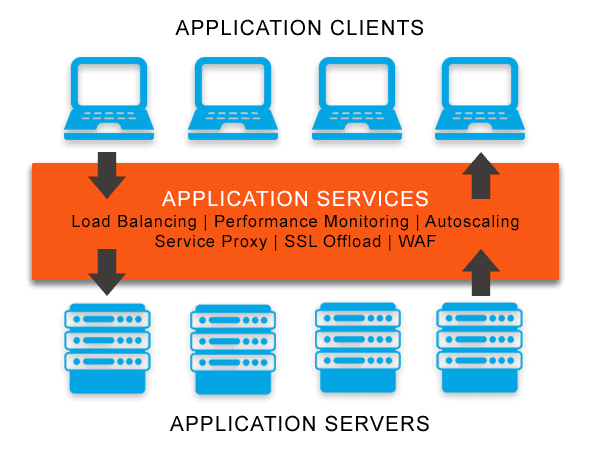
The VMware NSX Advanced Load Balancer’s distributed load balancers collect telemetry in the path of application traffic in real-time. This enables the platform to leverage its position, monitoring traffic spikes, detecting any anomalies—and, ultimately, the distributed denial of service (DDoS) attacks that often underlie these spikes in anomalous traffic.

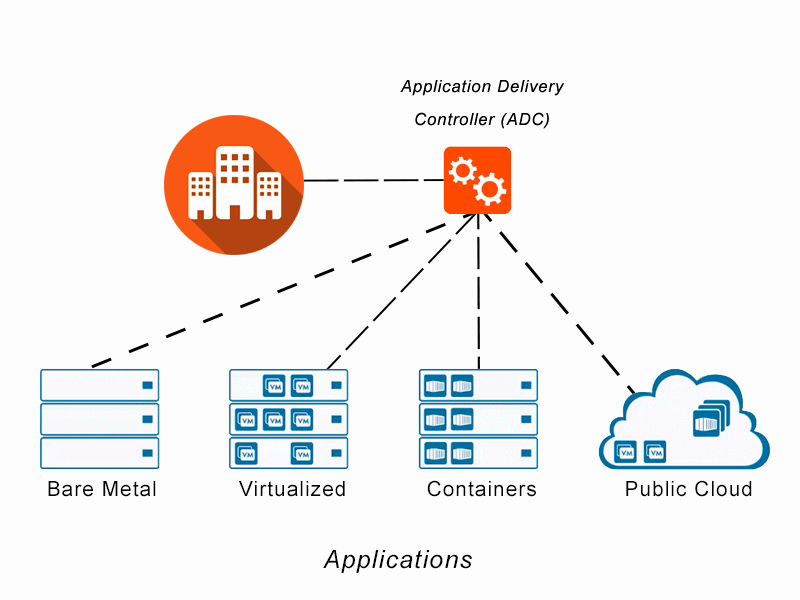
As an intrinsic feature of the Application Delivery Controller (ADC), the VMware NSX Advanced Load Balancer’s approach is inline, and does not demand any additional anomaly detection software integration. The VMware NSX Advanced Load Balancer’s intelligent approach allows for better decisions on detection of outliers, elastic capacity planning, prediction of load, and more.

The system is actionable, and with anomaly detection happening in real-time and mitigation actions built into operations, it’s also fast. Admins do not need to manually start a new server, block offending clients, or increase capacity based on predictions about resource utilization. The result is real-time, automatic anomaly detection.

For more information on the VMware NSX Advanced Load Balancer’s anomaly detection platform see: “Supercharging Anomaly Detection with the holt-winters Algorithm”.

For more on the actual implementation of load balancing, security applications and web application firewalls check out our Application Delivery How-To Videos.